


The Science of Hunga Tonga Global Warming - Part 3
The crisis in atmospheric science and the uniqueness of Hunga Tonga

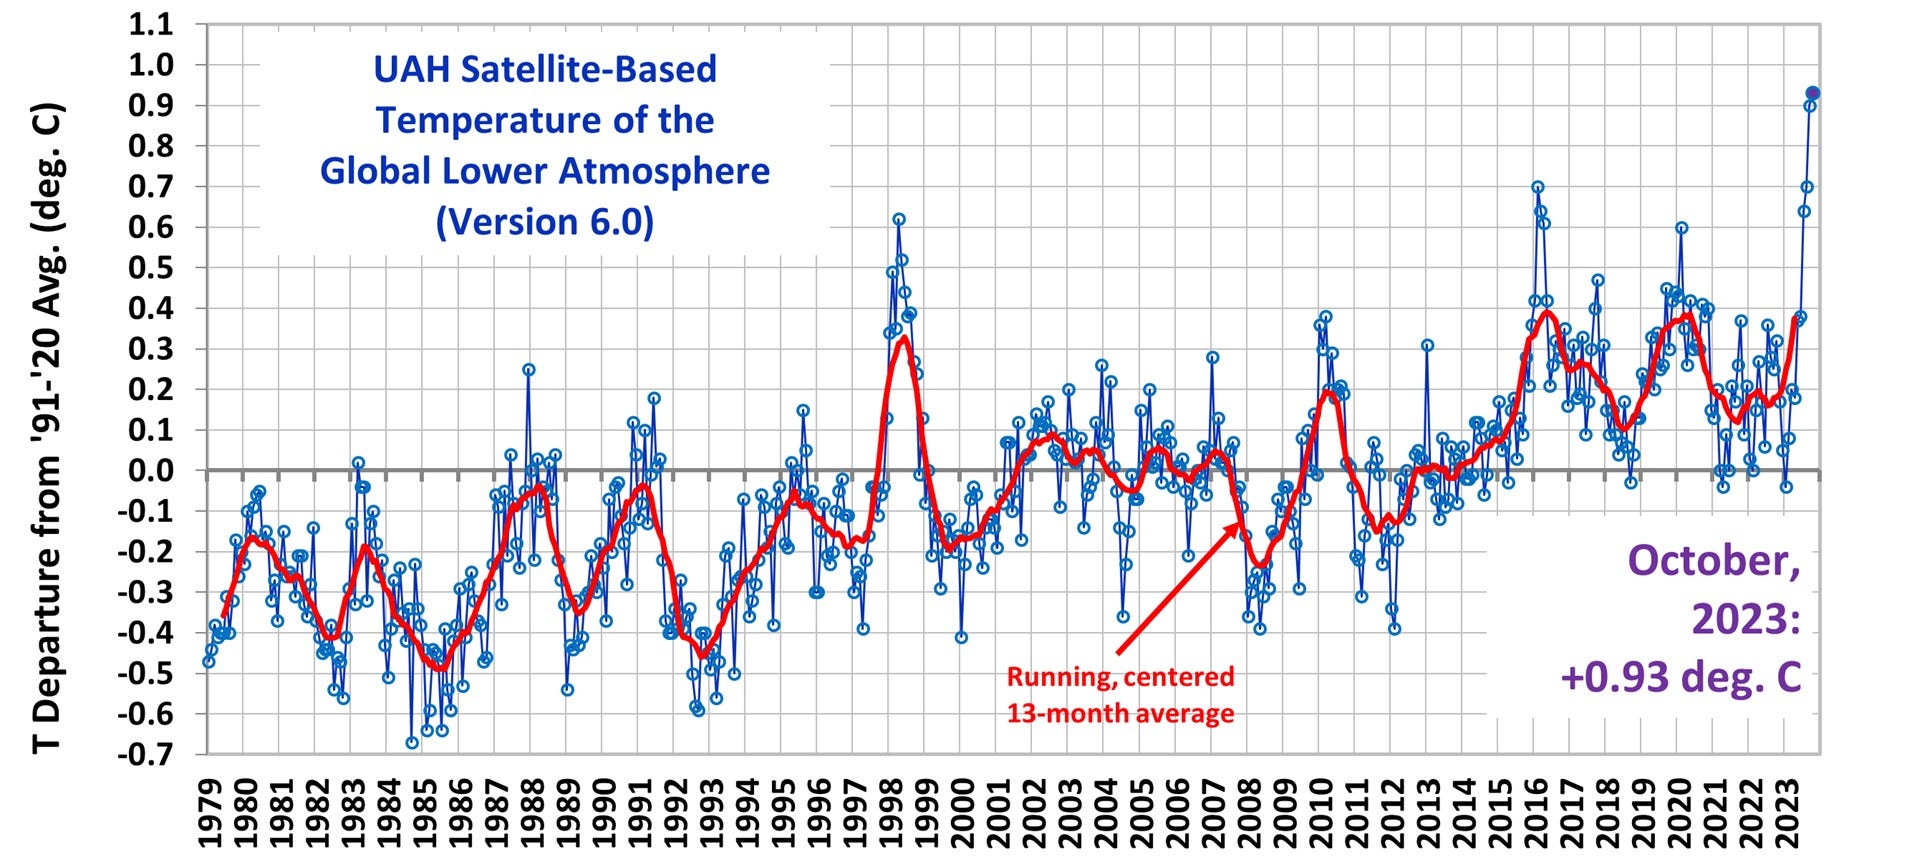
Atmospheric science is in crisis. The graph below proves it. You cannot deny data. Planet earth has warmed extremely rapidly in the last few months, obliterating past record warming due to previous very powerful El Ninos, and it currently shows no sign of cooling.
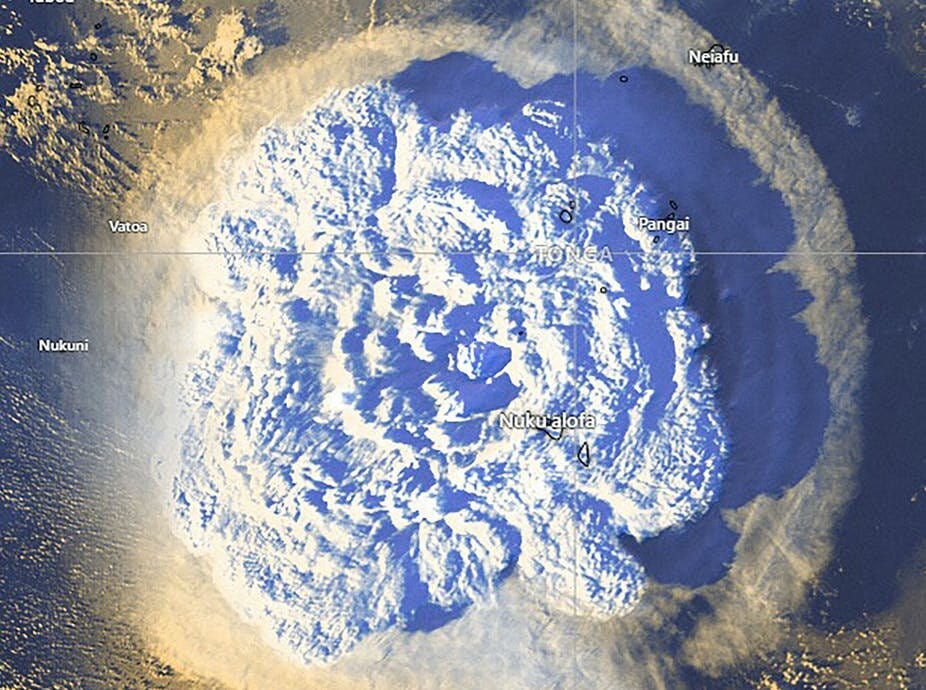
Scientists have no really convincing explanation for this sudden and explosive warming. Spencer and Christy, stating unequivocally that the warming due to Hunga Tonga will only be a modest ‘few hundredths of a degree’, have opted to blame a still developing moderate El Nino on this extraordinary warming. If the metrics of the current El Nino were anything like 1998 or 2016, that might be a convincing explanation for what we are observing, but they are not. Furthermore, the rapid warming is out of season for a typical El Nino, where we see a spike in global temperature more typically from Jan-Apr in the year immediately following the development of El Nino conditions, not starting in summer of the same year and continuing into autumn/winter. The observed warming cannot possibly be due to the slow accumulation of greenhouse gases in the atmosphere, because there has been no sudden acceleration of greenhouse gas concentrations, nor any huge and sudden emissions of GHGs from human activity. The overwhelmingly most likely candidate to explain the sudden intense lower tropospheric warming observed by satellites is Hunga Tonga, which must mean that atmospheric scientists have significantly underestimated the climate warming effects of the eruption which took place in January 2022. Extraordinary effects require an extraordinary cause and Hunga Tonga was indeed very extraordinary. To get an idea of just how extraordinary, I quote the following from a paper published in Geophysical Research Letters in July 2022:
Following the 15 January 2022 Hunga Tonga-Hunga Ha'apai eruption, several trace gases measured by the Aura Microwave Limb Sounder (MLS) displayed anomalous stratospheric values. Trajectories and radiance simulations confirm that the H2O, SO2, and HCl enhancements were injected by the eruption. In comparison with those from previous eruptions, the SO2 and HCl mass injections were unexceptional, although they reached higher altitudes. In contrast, the H2O injection was unprecedented in both magnitude (far exceeding any previous values in the 17-year MLS record) and altitude (penetrating into the mesosphere). We estimate the mass of H2O injected into the stratosphere to be 146 ± 5 Tg, or ∼10% of the stratospheric burden. It may take several years for the H2O plume to dissipate. This eruption could impact climate not through surface cooling due to sulfate aerosols, but rather through surface warming due to the radiative forcing from the excess stratospheric H2O.
The only unusual aspect of the SO2 plume is its injection height. SO2 plumes are typically injected at altitudes no higher than 46 hPa (∼21 km) (Carn et al., 2016; Pumphrey et al., 2015). HT-HH is the only injection observed by MLS that produced maximum values of SO2 at 14 hPa (∼29 km), with enhanced values detected up to 6.8 hPa (∼35 km)—outside the normally recommended pressure range for MLS SO2. By 27 January, the SO2 plume dropped below background levels (Figure S1 in Supporting Information S1).
The HCl injection was similarly unremarkable, with only 8 profiles during 16–18 January (barely) exceeding the threshold for enhancement (Figure 2c; Figure S1 in Supporting Information S1). As with SO2, the only unusual aspect of the HCl plume is its injection height of 31.6 hPa (∼24 km), whereas previous eruptions reached no higher than 68 hPa (∼18.6 km).
In contrast, the magnitude of the HT-HH H2O injection is unprecedented. Three natural pathways for direct injection of H2O into the stratosphere exist: overshooting convection, pyrocumulonimbus (pyroCb) storms, and volcanic eruptions. The previous stratospheric H2O record measured by MLS was 26.3 ppmv at 100 hPa associated with an overshooting convective event in August 2019 that spanned thousands of square kilometers and persisted for several hours (Werner et al., 2020). Two pyroCbs stand out in the MLS H2O record: the 2017 Pacific Northwest (Pumphrey et al., 2021) and the 2019/2020 Australian New Year's (Kablick et al., 2020; Khaykin et al., 2020; Schwartz et al., 2020) events. Only the Australian pyroCbs injected enough H2O to allow an accurate estimate of mass (19 ± 3 Tg).
The 2008 Kasatochi (Schwartz et al., 2013) and the 2015 Calbuco (Sioris et al., 2016) volcanic eruptions were the only others in the MLS record that injected appreciable amounts of H2O into the stratosphere. Neither deposited H2O at altitudes higher than 68 hPa (∼18.6 km), and both injections were too small for a reliable H2O mass estimate.
The HT-HH eruption injected at least 146 ± 5 Tg of H2O into the stratosphere, not only surpassing the magnitudes of all other injections in the MLS record, but also eclipsing a theoretical estimate of 37.5 Tg from Pinatubo (Pitari & Mancini, 2002). This stratospheric H2O injection is unique in the satellite record (1979 to date). To put the HT-HH injection into perspective, the enhancement represents ∼10% of the estimated stratospheric H2O burden of 1400 Tg (Glaze et al., 1997). Further, the H2O plume injection height far exceeded that of any other injections in the MLS record (Figure 3).
There is no precedent in the record for the enormous mass of water which was injected into the stratosphere by HT. It exceeded all other injections by at least an order of magnitude. But surprisingly, even small natural fluctuations in stratospheric water vapour can have a pronounced effect upon global temperature, as indicated by Susan Solomon in a 2010 study, of which I shall have more to say later. For now, we need only note what the authors of the current paper say about Solomon:
Radiative calculations of the sudden drop in H2O of ∼0.4 ppmv (at 100 hPa) in 2001 (Figure 5b) demonstrated that the radiative forcing from even small variations in lower stratospheric H2O could induce decadal-scale changes in global-mean surface temperature (e.g., Solomon et al., 2010). The unprecedented HT-HH enhancement would correspond to ∼1.5 ppmv (at 31 hPa) if averaged over 60°S–60°N.
So, even averaged over a wide area, assuming the water vapour cloud eventually disperses evenly across the stratosphere, the increase in the concentration of water vapour due to HT exceeds by almost 4 times the decrease in concentration noted by Solomon which resulted in a significant cooling contribution according to Solomon. Logically then, we might expect the HT stratospheric wv increase to result in even more significant warming over the lifetime of the enhanced water vapour perturbation (several years). We’ll look at Solomon et al in more detail in a subsequent post.
Another set of authors also mention Solomon and their paper (titled The Estimated Climate Impact of the Hunga Tonga-Hunga Ha'apai Eruption Plume) is probably the source of Spencer and Christy’s claim of HT warming the planet by a ‘few hundredths of a degree’. In contrast to others, the authors here claim that the HT eruption actually cooled the surface in the southern hemisphere in 2022 because the negative radiative forcing of the aerosols exceeded the positive radiative forcing of the water vapour.
On 15 January 2022, the Hunga Tonga-Hunga Ha'apai (HT) eruption injected SO2 and water into the middle stratosphere. The SO2 is rapidly converted to sulfate aerosols. The aerosol and water vapor anomalies have persisted in the Southern Hemisphere throughout 2022. The water vapor anomaly increases the net downward IR radiative flux whereas the aerosol layer reduces the direct solar forcing. The direct solar flux reduction is larger than the increased IR flux. Thus, the net tropospheric forcing will be negative. The changes in radiative forcing peak in July and August and diminish thereafter. Scaling to the observed cooling after the 1991 Pinatubo eruption, HT would cool the 2022 Southern Hemisphere's average surface temperatures by less than 0.037°C.
Here’s what the authors say about Solomon et al:
Changes in stratospheric water vapor can also contribute to changes in climate forcing (Forster & Shine, 1999). Solomon et al. (2010) estimated that the tropical, lower stratospheric decrease of ∼0.4 ppmv H2O between 2000 and 2005 would reduce tropospheric forcing by ∼0.098 W/m2. This forcing results from changes in the long-wave IR (LWIR) emission and short wave IR (SWIR) attenuation. Consistent with the Solomon et al. (2010) study, Dessler et al. (2013) determined the sensitivity of the of the climate system to tropical stratospheric water vapor and calculated a water vapor feedback parameter of 0.27 W/m2/ppmv.
0.098 Watts per square meter tropospheric forcing doesn’t sound like much does it? But bear in mind that this is over just a 5 year period and is due to a small increase in stratospheric water vapour of 0.4 ppmv. To put that in perspective, Solomon et al say that the radiative forcing from greenhouse gases over a 10 year period between 1996 and 2005 was +0.26 W/m2. So, positive GHG radiative forcing over 10 years is roughly 2.6 times that of negative water vapour radiative forcing over just 5 years due to a tiny drop in stratospheric water vapour concentration. We’re told that GHG radiative forcing results in a rise in surface temperature of 0.13C to 0.2C per decade. Do the math. It’s pretty obvious, all things being equal, that a sudden increase of at least 1.5ppmv in volcanic origin stratospheric water vapour persisting for several years is going to bump up surface temperatures considerably in the absence of any cooling from aerosols. That is what we’re seeing. Observations are confirming theory. So why are so many at pains to find other reasons for the sudden extraordinary increase in global temperature? Beats me.
The maths:
GHG forcing = 0.13W/m2 over 5 years = temp increase of approx. 0.1C (max)
Strat water vapour forcing (0.4ppmv) = 0.1W/m2 over 5 years = (0.1/0.13)x0.1 = 0.077C temp increase
So,
Strat water vapour temp increase over 5 years (1.5ppmv) = (1.5/0.4) x 0.077 = ~0.3C
This is 3 times the expected increase in surface temperature from GHG forcing over a five year period! This means that HT will dominate global warming for the next few years if these calculations are correct. Also, assuming post industrial warming is currently 1.2C, this means that we definitely will reach 1.5C warming over the next 5 years, probably less. Given that 1.5ppmv is probably a conservative estimate of the spatially averaged global distribution of water vapour perturbation, given that the cloud is maybe not so well mixed at this point and different regions of the stratosphere may have far higher elevated water vapour, even now, given also that there are probably other unknown factors at play, such as changes in global circulation induced by the HT eruption, which may in turn affect heat distribution around the globe and thus globally averaged surface temperature, the sudden 0.5C jump in global temperature which we have witnessed this summer and autumn does not look quite so mysterious.
Update 7th November 2023
A reader (brown tsunami) has kindly provided a scatter plot of the Southern Oscillation Index (SOI), which tracks the atmospheric part of La Nina/El Nino (in contrast to the oceanic component measured by ONI) against global mean temperature deviation measured by satellite. July, Aug and Sep 2023 are very clear outliers, increasingly so by month, which suggests strongly that the global temperature anomaly from July 2023 onwards is not related to SOI ( and hence El Nino conditions in the Pacific).

If we are faced with a spell of global warming above the dreaded 1.5°C lasting for several years as Jaime surmises, this will throw the climate alarmists into confusion. Firstly, it will be obvious that breeching 1.5 degrees makes very little practical difference to normal living.
Secondly, the El Nino will by then be spent and they will be forced to admit that HT has caused the sudden warming and that atmospheric H2O is a much more potent GHG than CO2, which sceptics have been saying for years yet alarmists have excluded from their climate models.
Thirdly, if it takes several years for the HT water vapour to finally dissipate, we will by then be approaching or even past the start of the cooling phase of the cyclical Atlantic Multidecadal Oscillation and global temperatures could start to fall quickly: https://www.climate4you.com/images/AMO%20DetrendedGlobalAnnualIndexSince1856%20With11yearRunningAverage.gif. See how well it correlates with the global cooling from the 1950s to the 1970s when scientists were convinced that we were about to enter a new ice age.
I find that pretty convincing. The problem is that in the run-up to COP28 (and indeed in its aftermath), the increase in temperature this year is just too convenient for alarmists to concede that its cause could be anything other than man-made.