


UK Heatwave Attribution II
'It would have been impossible if it hadn't happened!'

Yep, that is the basic conclusion of the experts’ rigorous statistical analysis of the two day extreme heatwave which occurred in parts of the UK on the 18th and 19th July. Even the all singing, all dancing, super sophisticated climate models running on mega expensive main frame computers using enough energy to power a small town concluded that it was an event which shouldn’t have happened. So, what did the authors of this attribution study conclude? They deduced the following: Without human-caused climate change temperatures of 40°C in the UK would have been extremely unlikely Like, wow. Remember the old Sherlock Holmes saying?
“Once you eliminate the impossible, whatever remains, no matter how improbable, must be the truth.”
Well World Weather Attribution have gone one better:
“If you exclude the probable and can’t eliminate the impossible, then what remains must be the truth.”
In which case, ‘No shit Sherlock’ becomes ‘That is some shit Sherlock’.
You think I’m joking don’t you? I’m not joking. So, fasten your seatbelts, fix your grins (or grimaces) on permanent and allow me to lead you into the dark heart of extreme weather attribution.
There are no less than 21 expert authors of this report, coming from a total of 17 prestigious global academic institutions including our very own (Chinese owned) Imperial College London and the Met Office. So it must be the business, right?
Event Definition
The magenta box is the study area and the authors chose to analyse the one day maximum temperatures on the 19th and the average of the two day maximum temperatures on the 18th and 19th inside the study area.
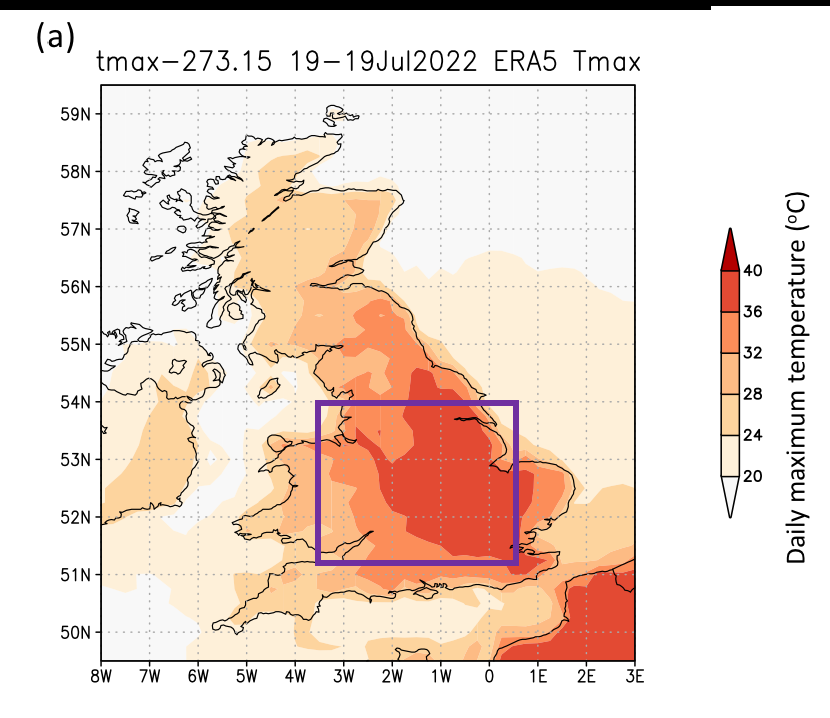

To investigate the extent to which human-caused climate change altered the frequency of occurrence of the extremely high temperatures, across the region affected by the most extreme heat (see Figure 1), we choose to analyse the 2-m temperature over land in the region 51.25-54 ºN, 3.5W-0.5 ºE (highlighted by magenta box in Fig. 1). This region covers the area of the red alert warning issued by the Met Office, including London, and the station where the daily maximum UK temperature record was broken on the 19th of July 2022. To account for the event itself, which lasted two days and nights, as well as for the record breaking temperature, we decided to use two event definitions, i.e. we analyse the annual maximum of 2-day average temperatures over this region as well as the annual maximum of the daily maximum temperature (TXx). Additionally, we analyse the change in frequency and intensity of the maximum observed daily temperature of 2022 at 3 locations: London’s St James Park, Cranwell in Lincolnshire which is geographically close to Coningsby, where the new UK record has been set, but has a longer observed time series, and Durham, which although is located outside the red alert area, has a very long record going back to 1880 and also experienced very high temperatures given its latitude of ~54.78 North. Temperatures at Durham were 36.9ºC, breaking the previous record by 4ºC.
Including Climate Change and Excluding Everything Else
That’s what the authors do here. They assume that the long term rise in global temperature (attributed almost entirely to man-made greenhouse gases) is the main driver of very brief periods of extreme temperatures locally. They mention other factors which might also have an influence, but then totally ignore them in order to arrive at their event attribution!
In most parts of the world there is very high confidence that the duration, intensity and likelihood of extreme heat has increased dramatically due to human-induced climate change (Seneviratne et al. 2021). This is particularly also the case in Europe, including the UK. The first event attribution study related to the European heatwave of 2003 (Stott et al 2004), and more recently, the joint UK temperature record set during the 2018 heatwave was found to be 30 times more likely due to human activity (McCarthy et al 2019).
Long-term changes in heatwaves are influenced not only by globally well-mixed greenhouse gases but also by more localised influences, including aerosol trends (Péré et al., 2011), land use changes (Cowan, Hegerl, et al., 2020), vegetation and soil moisture changes (Seneviratne et al. 2010, Donat et al., 2017), irrigation (Thiery et al., 2017), and urbanisation effects (Heaviside et al., 2017). Furthermore, the meteorological conditions conducive to heatwaves could change regionally by potential changes in mean atmospheric circulation or in the frequency of specific weather patterns leading to extreme heat (Horton et al., 2015).
Heatwaves, on the scales people experience them, are strongly influenced by the local energy budget that determines the use of energy between evaporation and heating, set by the land surface, vegetation, irrigation, and urbanisation. Other factors such as circulation changes or aerosols may also be important and feedbacks may well be misrepresented in climate models during these extreme circumstances (Vogel et al. 2018). Many of these drivers and feedbacks are not well-simulated in current climate models as evidenced by striking discrepancies between observed and modelled trends and variability in certain regions of the globe. Van Oldenborgh et al. (2022) show that the discrepancies cannot always be explained by natural variability and in some cases are well outside the range of CMIP historical simulations even in well-understood regions (Cowan, Undorf, et al., 2020; van Oldenborgh et al., 2018).
That’s what you call eliminating the probable.
Statistical Analysis - Temperatures at 2 Stations were so Extreme they were Impossible!
You read that right. Impossible. They had to include the impossible event in the trend in order to make it fit the statistical trend! Got that?
Although the attribution analysis in this study is performed with gridded data for events that are defined as regional averages, as an additional line of evidence, we also analyse the trends in annual maxima of daily maximum temperatures at 3 locations where peak temperatures were reported during the event, and estimate the return period of the 2022 records in the current and a 1.2 ºC cooler climates. Fig. 2 shows the time series of annual maxima at 3 stations- St James’s Park (Fig. 2(a)), Durham (Fig. 2(b)) and Cranwell (Fig. 2(c)). All stations show increasing trends for this period, consistent with global warming signals observed for Central England temperatures (CET; Karoly and Stott, 2006).


Here comes the best bit (my bold):
Fig. 3 shows the trend fitting methods described in Philip et al. (2020) applied to the annual maxima of daily maximum temperature, for these three stations. The behaviour of the location parameter with respect to the GMST (panels a,c,e in Fig. 3) is found to increase with GMST. At St James’s Park and Durham, the chances of observing 2022 values are only possible, when the possibility of the event occurring is included in the fit; Fig. A(b, d)). At Cranwell, such temperatures are still extremely rare, with a return time of 1600 years when the event is not included in the fit (Fig. 3(f)). By including the 2022 event in the fit, the return times of the 2022 event, although rare, are found to be significantly reduced- 590, 1100 and 150 years, respectively, for the three stations (not shown).
What on earth is going on here? To get to the bottom of what they are saying you have to dig a little deeper.
Generalised Extreme Value (GEV) Distributions
Very briefly, this is what the authors use to generate their upper bound extreme temperatures, based on the long term rise in mean global surface temperature. Don’t quote me on this, because I’m not familiar with the exact statistical methods they use to generate extreme values, but basically I believe they assume a normal distribution of local temperature, with extreme tails, like so:
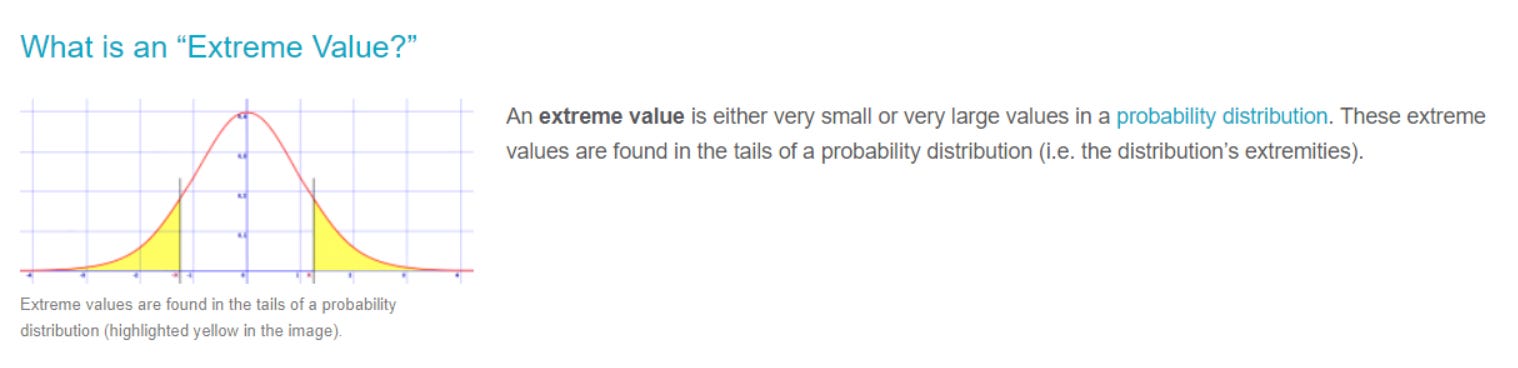
When global mean surface temperature increases, this normal distribution ‘shifts’ to the right by an equal amount and what happens is, extreme high temperatures, previously virtually impossible under the old normal distribution become more likely, though still rare. This method assumes that the rise in global mean surface temperature is the only factor which affects the consequent increase in the probability of experiencing extreme high temperatures. Hence the authors cite Phillip et al (2020) above, which says (my bold):
It is assumed the events follow a theoretical distribution, such as a Gamma distribution (based on all data) or one of the extreme value distributions discussed below that is based on events in the tail only. If the event is not very extreme, a normal distribution can also be used. In general this implies that we assume that more moderate extremes behave the same as the more intense extreme that is under investigation, and these provide the higher number of events necessary to detect a trend.
It is assumed that the main changes in the distribution are due to global warming. In the global mean temperature, the influence of natural forcings over the last 70 or 120 years has been very small compared to the anthropogenic forcings (Bindoff et al., 2013). If we take the smoothed global mean temperature as a covariate, both anthropogenic and natural forcings are included. Note that while using smoothed global mean temperature we cannot attribute changes to local forcings, such as aerosols, irrigation, and roughness changes, which can also have large influences on extremes (Wild, 2009; Puma and Cook, 2010; Vautard et al., 2010). This should always be kept in mind and checked when possible. If factors other than global warming are important for changes in the distribution, attribution to global warming alone is not appropriate and additional investigation should be conducted.
It is assumed that the distribution of temperature extremes shifts due to global warming without changing the shape.
So there you go. Using their GEV fit, the authors of this current attribution study make the above assumptions (i.e. they exclude the probable) and they find that, in 2 stations out of 3, the temperatures recorded would be impossible even in a world which is 1.2C warmer due to global warming! Thus, they have to shoe-horn those ‘impossible’ extreme temperatures into a new statistical distribution in order to arrive at realistic probabilities of the return times.
Climate Model Simulations Also Fail To Simulate Extreme Temperature Observations
The climate models also confirm the results of the statistical analysis, namely that the extreme high temperatures recorded, especially on the 19th, are just too extreme. In fact, the climate model simulations predict only a 2C rise in extreme temperature for this event, not a 4C increase as observed.
As has been observed in previous attribution studies on European heat waves (e.g. Vautard et al., 2019), climate models show a systematically lower trend than the observations which in particular means that the change in intensity in the models is much lower than in observations. They also often show too high variability. Even for models that do capture the trend, this often happens for the wrong reasons as has been assessed in van Oldenborgh et al. (2022). Using De Bilt in the Netherlands as an example they found that in many locations the discrepancies between observed and modelled trends are much larger than can be expected on the basis of natural variability and model spread alone.
Because of this systematic discrepancy, providing quantitative synthesised estimates of the change in intensity and frequency is difficult as the upper bound is very ill defined and largely infinite, while the lower bound is almost certainly an underestimation given the model deficiencies.
The change in intensity is only about 2C in the models, while it is 4C in the observations.
The observational analysis shows that a UK heatwave as defined above would be about 4C cooler in preindustrial times.
To estimate how much of these observed changes is attributable to human-caused climate change we combine climate models with the observations. It is important to highlight that all models systematically underestimate the observed trends. The combined results are thus almost certainly too conservative.
These are not ‘cool’ models either; the authors’ list of models included in the analysis contains some very ‘hot’ models indeed.


It’s not the full list above but CAN ESM and HadGem GC3.1, just for example, have equilibrium climate sensitivities well in excess of 5C, so if anything, you would expect the climate ensemble simulations to overestimate the increase in extreme high temperatures, not seriously underestimate it.
There is obviously something very amiss here. The models and the statistical analyses fail miserably to account for the observed 2 day extreme temperatures and especially the 40C+ temperatures recorded very briefly on the 19th. Something else is going on. It’s not global warming. My guess is that it is a combination of changing atmospheric circulation patterns, increasing urban encroachment upon weather stations and changes in land use, all contributing to the very high temperatures observed.
But hey, when you’re a climate ‘scientist’ and your models don’t work and your statistical analysis requires you to make the impossible possible, then you just say it was Climate Change (TM) wot dunnit regardless; therefore we should be afraid, be very afraid, because even the Science (TM) underestimates the severity of what’s happening.