
The Evolving Pseudoscience Of Extreme Weather Attribution: Reconfiguring The 'Impossible' As The New Normal Reality

More and more often, extreme weather attribution magicians are finding that, when presented with the task of trying to attribute extreme weather to climate change (especially extreme high temperatures), they can’t, because even in the current warmer climate, the actual observed temperatures turn out to be statistically impossible when they are referenced against the maximum temperatures generated by their statistical analyses! Also, when attempting to model extreme daily maximum temperatures using the sophisticated climate models, our climastrologist magicians are finding that even their ‘hot’ models only manage to project 50% of the actual observed increase in extreme temperatures. This means, effectively, that no attribution can be done, using their own ‘science’. ‘Something else’ other than the generalised global warming trend must necessarily have caused or contributed to the extreme high temperatures observed. But being climastrologists of course, they still manage to state with confidence that the ‘impossible’ event was made more likely by climate change!
I’ve covered two such cases of attribution studies coming up against ‘impossible’ temperatures here:

When reported by the media, the common trick employed is to say that the event in question would have been ‘impossible without climate change’. Yes, it would have, according to what the ‘science’ says. But what they don’t tell you is that the event would have been statistically impossible even with climate change, according to the very same ‘science’ they are quoting, thereby inviting you naturally to make the false assumption that such an extreme event was only made possible by climate change. Sneaky barstewards.
As I pointed out in the articles above, the authors of the UK and Pacific Northwest (PNW) heatwave attribution studies discovered that the event they were analysing was statistically impossible, but rather than simply admit that their attribution attempt failed, they hammered the proverbial square peg into a round hole instead and force-fitted the ‘impossible event into a tortuous and highly dubious statistical distribution in order to calculate a realistic ‘return time’ (how often the event would be expected to recur) for the current climate and for a future warmer climate. In reality, in the current climate, the event would not be expected to occur, so the return time would be extremely large or infinite.
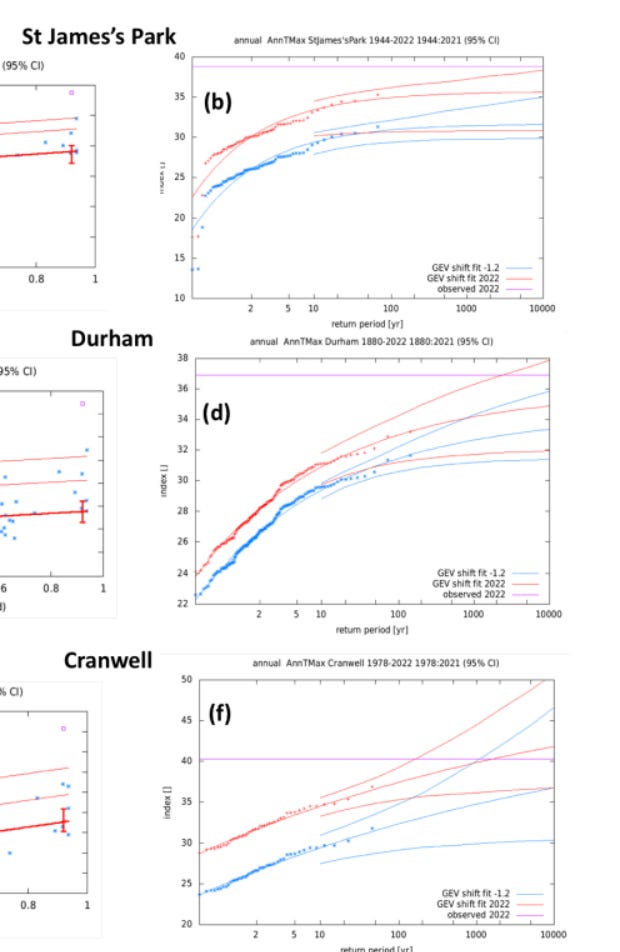
For the UK heatwave of July 2022, here are statistical ‘generalised extreme value’ (GEV) distributions for the current climate and a hypothetical cooler climate not warmed by man-made greenhouse gases:
This is what I wrote:
As you can see, in the case of Cranwell, the red (1.2C warmer world) line intersects the magenta line somewhere beyond a return time of 1000 years. Being a log scale along the horizontal axis, I imagine this means that, even in a warmer world, the temperature at Cranwell can be expected to happen only about once every 1500 years, i.e. it’s still a very rare event. Looking at St James’ park, the red central line never intersects the magenta line, even out to 10,000 year return times and it doesn’t look like it is going to beyond that. Even the upper 95% confidence bound does not intersect the magenta line. This effectively means that the temperature recorded at St James’ Park is impossible in a 1.2C warmer world - therefore something else other than climate change must have contributed to this extreme reading.
At Durham too, the central estimate never gets anywhere near the magenta line, but the 95% CI upper bound does intersect beyond a return period of 1000 years. This implies also that the temperature recorded at Durham is virtually impossible. So that’s two out of three stations where the recorded temperatures would have been impossible or nearly impossible even in a world warmed supposedly by emissions of greenhouse gases.
With the PNW heatwave, the ‘impossibility’ of the event was even more obvious:

The climate change ‘shifted’ GEV distribution (red) is never going to intersect with the 39.5C magenta line at the top, meaning that such a temperature in today’s climate is statistically impossible if climate change is the only thing driving this heatwave, so therefore it must be something else causing this extreme temperature. The press didn’t report it like that though, they stated only that such a heatwave would be impossible in a world without climate change. Here’s what the authors did: they constructed a new distribution by including 2021.
The authors considered two possibilities:
Reject the 2021 as being impossible, therefore attribution fail.
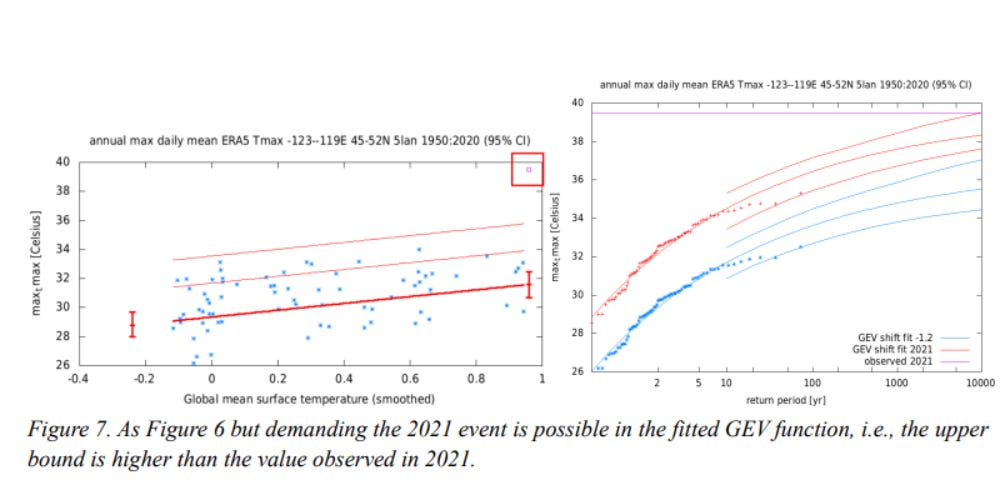
Demand that the 2021 event is possible and fit a new GEV distribution.
That’s what they did in Fig.7. Note the data points become perilously close to the lower 95% confidence interval and note that the last data point is mysteriously shifted upwards in Fig.7 compared to Fig.6 so that it just falls within the 95% confidence bound. That’s what you call data torturing! But even that wasn’t enough. The 95% upper confidence bound of the distribution intersected the actual event only at 10,000 years, meaning the event was still incredibly rare. Oh dear, what’s a climastrologist to do? The powers that be are demanding that this extreme event be linked to climate change. The presstitutes are waiting to spread the news. They decided on a third option:

If you don’t understand that, then join the club; neither do I! Here’s the whacky graph they produced:

LOL. They had to torture the data so much that they even ended up with a blue datapoint (a world without climate change) shifted so far upwards that it was warmer than most of the red datapoints! Utterly absurd.
However, mission accomplished, they managed to squeeze out a more realistic return time of 1000 years, allowing them to claim that in the current climate, the event was merely ‘rare’, not ‘impossible’. This furthermore allowed the authors to calculate (based on an extremely implausible global warming scenario over the next two decades) that this hitherto ‘impossible’ event, made possible (but still rare) by the magic of statistical manipulation, could happen every 5-10 years by the early 2040s if we don’t ‘tackle climate change’. Outrageous!
In Part II, I’ll be looking at another recent analysis of the NWP heatwave which I suspect may form the template for incorporating these ‘impossible’ events into a new climate changed reality. Science progresses: pseudoscience just grows another head.
Excellent. Thank you.
Thanks so much for breaking that down. It really helps some of us find our footing at a time when TPTB are trying to advance their agenda through manipulation of data and control of information.