
Oops - Met Office Publish Graph Which Shows Almost Beyond Doubt That Recent Warming In The UK Is NOT Predominantly Man-Made

h/t Mark Hodgson
I just noticed this, whilst searching online for the ‘State of the UK Climate 2022’. It hasn’t been published by the Met Office yet, but will be published very soon, no doubt accompanied by the usual alarmist fanfare in the MSM. Back in Jan this year, Mark McCarthy, Nikos Christidis and Peter Stott (the usual suspects) posted this pre-empt to the full analysis at Carbon Brief:

It starts off with the usual ‘OMG, climate change!’ guff:
Last year was a dramatic one for the UK’s climate.
The year of 2022 will be remembered for the passing of two significant milestones – a daily maximum temperature of more than 40C and a national average temperature over the year of more than 10C.
In this review, we unpack the UK’s climate of 2022 and show that both these notable records were highly unlikely to have occurred without the influence of human-caused climate change.
Boring. Predictable. But then the authors do something interesting, they publish this graph, with the following explanation:
 UK and (black) Central England Temperature. Dashed horizontal lines represent the 1991-2020 climatology for each series (which is 0.8C warmer than 1961-90 for both series). Credit: Met Office.")
Currently, our official statistics for the UK go back to 1884 for temperature . . . . . .
But we also have the Met Office Central England Temperature series (CET), which spans 1659-2022. This is the longest instrumental climate series in the world and the result of pioneering work by the scientist Gordon Manley in the mid-20th century. He uncovered historical weather records and diaries extending back several centuries, culminating in the construction of a temperature series representative of central England from 1659 . . . . . .
It is worth noting that 2022 was the warmest year in both the UK-wide and CET records.
We often get asked about the differences between the two series, but in much the same way that the rankings and values for each of England, Scotland, Wales and Northern Ireland can differ, so can the CET and UK series.
However, although there are inevitable differences between the two datasets for any given date, the overwhelming message from plotting these annual temperature series together is how closely they agree – overlapping by around 97%.
You can see this in the chart below, which shows the full CET record (black line) with the UK-wide record overlaid (red line). The dashed lines show the 1991-2020 reference periods in the two records for comparison.
The CET series therefore provides strong evidence that it is highly unlikely that a UK-wide warmer year could have occurred in the last 364 years. The year-to-year, and even decade-to-decade variability, in our climate is evident in this long time series but it can also be seen that the warming of our climate means that a cold year now, such as 2010, is not as severe as cold years of past centuries, while a warm year now, such as 2022, is much more likely to break records.
The reference climatology for our current climate is the period 1991-2020, and it is noteworthy that in the 332 years before this – from 1659 to 1990 – there were only 12 years with an annual average temperature above this modern day baseline, highlighting how climate change is moving UK average temperatures outside of historical ranges.
They are using the very close correlation between annual mean CET and the later UK wide temperature series to come to the conclusion that the UK is the warmest it’s been since 1659 and that it’s climate change wot dunnit. Well yes, agreed, in terms of annual mean temperature, the UK is considerably warmer than it was in 1659. But, having demonstrated that CET annual mean temperature is a reliable indicator for the UK as a whole, we can now examine in detail the ups and downs of the UK climate going back to the mid 17th century and what we see is a very interesting picture which belies the simplistic notion put forward by the Met Office and our government that recent warming in the UK has been caused almost exclusively by man-made greenhouse gases.
First off, it blows a hole in the Met office recent claim that June 2023 was the ‘warmest on record’ because it wasn’t, as I showed here:
Questioning Met Office Hot June/Climate Change Propaganda

They’re at it again. They can’t stop themselves. Apparently, it’s been the hottest June in the UK and in England since records began in 1884:
Now we know that CET is a good proxy for UK mean annual temperature, we can reasonably presume that the monthly means are probably quite accurate too, which means that June 2023 was nowhere near the hottest June that we have experienced in the UK. So we can immediately dispense with that most recent Met Office propaganda courtesy of the Stott, McCarthy and Christidis graph.
But there’s more. Much more. Look at the ups and downs of CET. What causes them? In particular, look at the warming from the 1680s to about 1730, a period of just 50 years. It was huge, exceeding both in magnitude and rapidity the observed UK warming from the end of the 70s to present (45 years), which is attributed in its entirety to the accumulation of greenhouse gases in our atmosphere. What caused that warming? Peat burning? 4x4 horse drawn carriages? The UK climate has warmed and cooled several times over the centuries, all the while gradually warming overall since the end of the Little Ice Age. Most notably, it warmed considerably from about 1890 to the end of the 1940s and then it cooled quite significantly in the 50s, 60s and 70s. What caused the early 20th century warming and the mid 20th century cooling? It wasn’t greenhouse gases - there weren’t enough in the atmosphere. ‘Scientists’ tell us that the mid 20th century cooling was caused mainly by aerosols from industry. Yeah right, so what caused all the earlier episodes of cooling then?
‘Scientists’ tell us that the sun doesn’t much affect the UK climate and does not explain recent warming, but it just so happens that the coolest period of the Little Ice Age in Britain (1645-1715) coincided with the Maunder sunspot minimum and the modern warming has coincided with the modern solar maximum which began in the 1950s and ended at the beginning of the 21st century. UK temperatures haven’t moved much in the 21st century and hence the Met Office has had to engage in some decidedly dodgy statistical manipulation recently to prove that the trend is still upwards:
Before
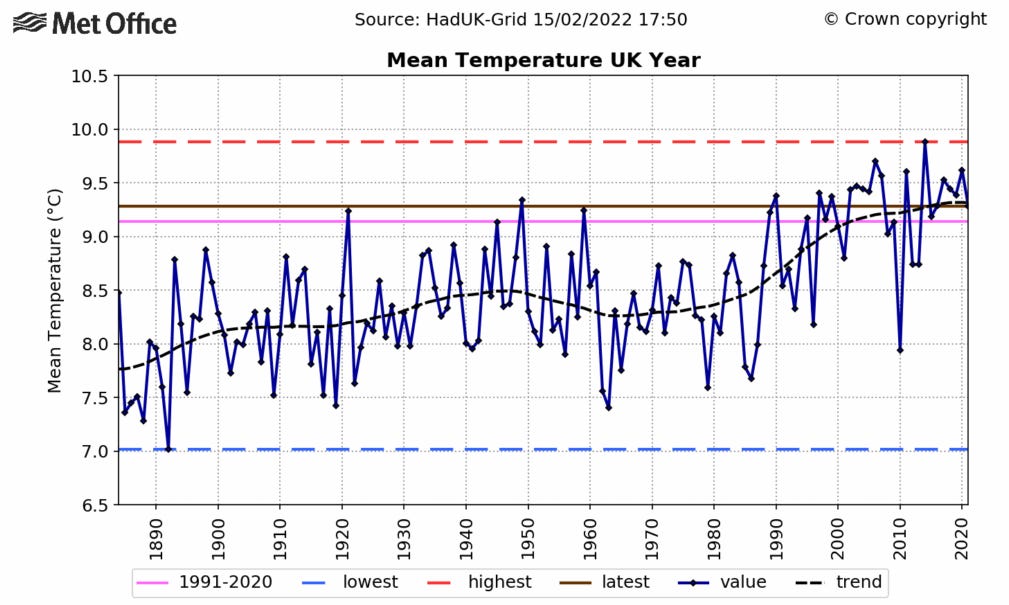
After

Something’s not right there. One hot year at the end of the series should not produce such an acceleration in the trend.
Besides the Sun possibly affecting UK climate, here is a graph of the Atlantic Multidecadal Oscillation, which we know for sure does affect the UK climate over decadal timescales.
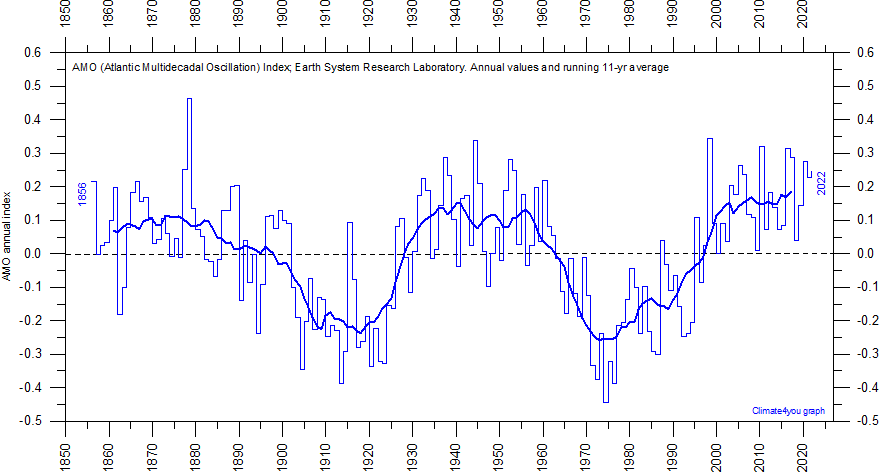
What do we notice by comparing this graph with the Met Office temperature graph?
The 1940s warming coincides with the positive peak phase of the AMO, the mid 20th century cooling coincides with the negative phase of AMO, which bottomed out in 1975 and the rapid warming from the late 1970s to the early 21st century correlates exactly with the upturn in AMO. Of course, ‘correlation is not causation, blah, blah, blah,’ they will say, but this shows at the very least that it is highly likely that the AMO contributed significantly to modern UK warming post 1979, which brings into serious doubt the claim that virtually all recent warming is man-made. With the fact that the UK climate has demonstrably oscillated between warm and cool periods over centuries, with the fact that those oscillations are comparable to, or even greater than modern warming, with the fact that the UK climate has been warming gradually overall since the end of the Little Ice Age and that we have two plausible natural explanations to explain at least some, if not a large majority of climate change in the UK, the claim by the Met Office that current climate change (and weather variability) in the UK is driven entirely by man-made global warming looks very suspect.
“Since I am no longer affiliated with any organization nor receiving any funding, I can speak quite frankly….As a scientist I remain skeptical.” - Atmospheric Scientist Dr. Joanne Simpson, the first woman in the world to receive a PhD in meteorology and formerly of NASA who has authored more than 190 studies and has been called “among the most preeminent scientists of the last 100 years.”
“Inevitably in climate science, when data conflicts with models, a small coterie of scientists can be counted upon to modify the data...That the data should always need correcting to agree with models is totally implausible and indicative of a certain corruption within the climate science community.” Dr. Richard Lindzen, professor of atmospheric science, MIT
Dr. John Clauser, the co-winner of the 2022 Nobel Physics prize and one the world’s leading authorities on quantum mechanics, blasted “climate emergency” claims as a “dangerous corruption of science that threatens the world’s economy and the well-being of billions of people.” Clauser, who was also awarded the 2010 Wolf Prize in Physics, the second most prestigious physics award after the Nobel, warns that misguided climate science is a hoax that is being driven by “massive shock-journalistic pseudoscience.”
Claude Allegre, a “founding father of AGW theory,” has now come out against this, stating “The cause of this climate change is unknown.”
“What historians will definitely wonder about in future centuries is how deeply flawed logic, obscured by shrewd and unrelenting propaganda, actually enabled a coalition of powerful special interests to convince nearly everyone in the world that carbon dioxide from human industry was a dangerous, planet-destroying toxin. “It will be remembered as the greatest mass delusion in the history of the world - that carbon dioxide, the life of plants, was considered for a time to be a deadly poison.”— Richard Lindzen, professor emeritus of atmospheric science, MIT. Source https://www.sec.gov/comments/climate-disclosure/cll12-8855233-238421.pdf
Lindzen also wrote “The notion of a static, unchanging climate is foreign to the history of the Earth or any other planet with a fluid envelope. Such hysteria (over global warming) simply represents the scientific illiteracy of much of the public, the susceptibility of the public to the substitution of repetition for truth.”
Dr Roy Spencer, a principal research scientist at the University of Alabama in Huntsville, has indicated that out of the 21 climate models tracked by the IPCC the differences in warming exhibited by those models is mostly the result of different strengths of positive cloud feedback – and that increasing CO2 is insufficient to explain global-average warming in the last 50 to 100 years.
Professor Antonino Zichichi, holder of Italy’s highest merit order, the Knight Grand Cross of the Order of Merit of the Italian Republic, which honor was awarded to Zichichi for a lifetime of distinguished scientific work including several discoveries in the field of sub-nuclear physics, in 2019 led a group of 48 Italian science professors in stating that human responsibility for climate change is “unjustifiably exaggerated and catastrophic predictions are not realistic…natural variation explains a substantial part of the global warming observed since 1850.” Similarly, four Italian scientists, including three physics professors, undertook a major review of historical climate trends concluding there is no real data to support any declaration of a “climate emergency…no clear positive trend of extreme events.” (Slay News adds that “Of course, cherry-picking single bad or “extreme” weather events will provide the main propaganda firepower for convincing populations that a globalist de-industrialization must take place within less than 30 years..”
In 2023, leading nuclear physicist Dr. Wallace Manheimer warned that so-called “Net Zero” goals will end modern civilization. The wind/solar combo will fail, cost trillions, trash the environment and “and be entirely unnecessary.” He also noted that CO2, necessary for life, is not “an environmental poison”; rather it is need for photosynthesis and produces oxygen. In fact, C02 is greening the earth.
Dr. William Happer, professor emeritus of physics at Princeton University, ”There isn’t a climate crisis. There will not be a climate crisis. It is utter nonsense.” https://www.sec.gov/comments/climate-disclosure/cll12-8855233-238421.pdf
Piers Corbin, astrophysicist, founder of Weather Action, 2002 said that current weather patterns have nothing to do with man-made climate change. Instead, Corbin flatly states that those pushing this narrative are just trying to make money. “Climate has always been changing,” and “this has nothing to do with man.” Weather this year is “caused by circulation patterns… and CO2 does not cause circulation patterns. What causes those is a combination of solar activity and the phases of the moon” ; the only connection with man is that he is “here at the same time the sun and the moon are doing things. A very similar situation happened about 132 years ago where there was the same sun, magnetic, lunar states (and) there was a heat wave in Russia and floods in Pakistan as now. These things are dictated by solar activity and the moon and nothing to do with mankind. Those who say that are just trying to make money… I assure you, this has nothing to do with carbon dioxide”
“The climate scare (is) the biggest deception in history…”Dr. Tim Ball, environmental consultant and former climatology professor at the University of Winnipeg in Manitoba
Warming fears are the “worst scientific scandal in the history…When people come to know what the truth is, they will feel deceived by science and scientists.” - UN IPCC Japanese Scientist Dr. Kiminori Itoh, an award-winning PhD environmental physical chemist.
“The IPCC has actually become a closed circuit; it doesn’t listen to others. It doesn’t have open minds… I am really amazed that the Nobel Peace Prize has been given on scientifically incorrect conclusions by people who are not geologists,” - Indian geologist Dr. Arun D. Ahluwalia at Punjab University and a board member of the UN-supported International Year of the Planet.
“Creating an ideology pegged to carbon dioxide is a dangerous nonsense…The present alarm on climate change is an instrument of social control, a pretext for major businesses and political battle. It became an ideology, which is concerning.” - Environmental Scientist Professor Delgado Domingos of Portugal, the founder of the Numerical Weather Forecast group, has more than 150 published articles.
“The models and forecasts of the UN IPCC "are incorrect because they only are based on mathematical models and presented results at scenarios that do not include, for example, solar activity.” - Victor Manuel Velasco Herrera, a researcher at the Institute of Geophysics of the National Autonomous University of Mexico
“It is a blatant lie put forth in the media that makes it seem there is only a fringe of scientists who don’t buy into anthropogenic global warming.” - U.S Government Atmospheric Scientist Stanley B. Goldenberg of the Hurricane Research Division of NOAA.
“Even doubling or tripling the amount of carbon dioxide will virtually have little impact, as water vapour and water condensed on particles as clouds dominate the worldwide scene and always will.” – . Geoffrey G. Duffy, a professor in the Department of Chemical and Materials Engineering of the University of Auckland, NZ.
“After reading [UN IPCC chairman] Pachauri's asinine comment [comparing skeptics to] Flat Earthers, it's hard to remain quiet.” - Climate statistician Dr. William M. Briggs, who specializes in the statistics of forecast evaluation, serves on the American Meteorological Society's Probability and Statistics Committee and is an Associate Editor of Monthly Weather Review. (Note: there really IS a Flat Earth Society, at http://www.theflatearthsociety.org/cms/, whose president Daniel Shenton, thinks “the evidence suggests fossil fuel usage is contributing to global warming.” (See www.tinyurl.com/ozn2wfe. So much for Obama’s comment that “We don’t have time for a meeting of the Flat Earth Society.”
“For how many years must the planet cool before we begin to understand that the planet is not warming? For how many years must cooling go on?" - Geologist Dr. David Gee the chairman of the science committee of the 2008 International Geological Congress who has authored 130 plus peer reviewed papers, and is currently at Uppsala University in Sweden.
The recent World Climate Declaration signed by around 250 university professors, and led by a Nobel physics laureate, noted that models had many shortcomings, “and are not remotely plausible as global policy tools” This declaration notes that natural as well as anthropogenic factors cause warming, warming is far slower than predicted, climate policy relies on inadequate models, CO2 is plant food, the basis of all life on Earth, global warming has not increased natural disasters, and that climate policy must respect scientific and economic realities
Patrick Moore, co-founder of Greenpeace, http://www.theenergyreport.com/pub/na/11079 and whose boat I have personally been on in Vancouver Harbour in the 1980s.
“I am a skeptic on climate change. I know the climate is changing, and it always has been. I've studied this intensively over many years. I started what I call the Carbon Project here in British Columbia back in 1989 in order to bring everybody together to discuss this subject and figure out the facts behind it. Since then, I have watched as hysteria has grown, as if the whole world is going to come to an end and civilization is going to die because of humans causing this climate change. I don't buy that, and I certainly know we don't have any proof of it. I'm not denying that we might be playing some role, but the natural factors that have always caused climate change have not suddenly disappeared. I'm very skeptical of the alarmist nature of climate campaigning.”
Moore later wrote in his book Fake Invisible Catastrophes and Threats of Doom (WattsUpWithThat summary here or Technocracy News summary here) that “A while back it dawned on me that the great majority of scare stories about the present and future state of the planet, and humanity as a whole, are based on subjects that are either invisible, extremely remote, or both. Thus, the vast majority of people have no way of observing and verifying for themselves the truth of these claims predicting these alleged catastrophes and devastating threats. Instead, they must rely on the activists, the media, the politicians, and the scientists – all of whom have a very large financial and/or political stake in the subject – to tell them the truth. This welcomes the opportunity to simply invent narratives such as the claim that “CO2 emissions from burning fossil fuels are causing a climate emergency.”