


Office For Nobbled Statistics Unveils 'New Method' Of Estimating Excess Deaths


Statistics is definitely not my thing, so bear with me whilst I try to muddle through this and make sense of it. I’m sure that we’ll be seeing more erudite and informed commentary from those trained in statistical analysis, but this is just my personal impression as a complete amateur.
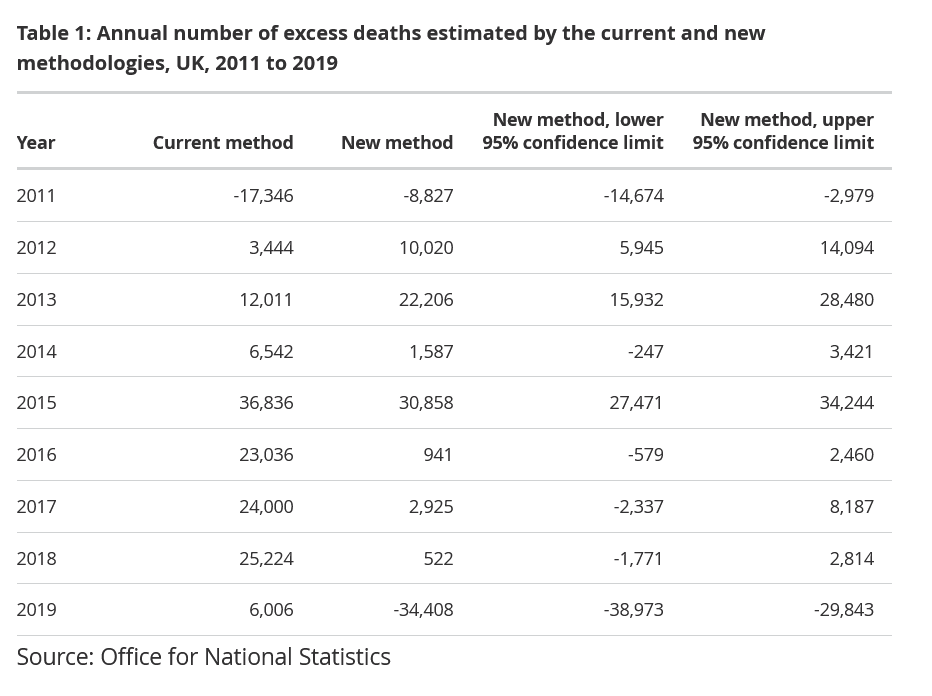
Firstly, what is ‘excess death’? It is simply the number of deaths, overall, across all age groups, above and beyond those which would be expected to occur ‘normally’. Up until now, the ONS has estimated ‘normal’ deaths as the five year average of the years preceding the year in question. So if the 5 year average number of registered deaths was X, but X+N deaths occurred in the year immediately after this 5 year period, then N is the excess deaths for that year. Simples. Seems quite logical to me. But the ONS are not happy with this Meerkat method and they think they have devised a new improved method of estimating excess death numbers:
Trends in population size, ageing and mortality rates are accounted for by the new method for estimating the expected number of deaths used in the calculation of excess mortality (the difference between the actual and expected number of deaths); this is not the case for the current method, which uses a simple five-year average to estimate the number of expected deaths.
Individual weeks and months that were substantially affected by the immediate mortality impact of the coronavirus (COVID-19) pandemic are removed from the data when estimating expected deaths in subsequent periods, whereas the current approach involves removing data for the whole of 2020.
Use of a statistical model means that multiple demographic, trend, seasonal and calendar effects can be included simultaneously in the estimation of expected deaths, and confidence intervals can readily be obtained.
A "bottom-up" approach to aggregation means that estimates of excess deaths are additive across age groups, sexes, and high-level geographies, and between months and years.
Having a common methodology for all four UK countries means that estimates of excess deaths are consistent and comparable across all parts of the UK, and the new methodology is largely coherent (though not identical) to that used by the Office for Health Improvement and Disparities to estimate excess deaths in English local authorities.
The bit in bold I understand; the rest just seems like waffle to me. So I’ll focus on the bold. The ONS think they have identified and now better understand trends in ageing, population size and mortality, which naturally affect the number of ‘normal’ deaths expected to occur in any given year. From what they’re saying, these trends must be significant even over 5 years, thus affecting estimates of the number of ‘normal deaths’ contributing to the registered deaths in any given year, thus necessitating the development of a brand new methodology.
2020 was a problem. Loads of people died because of a ‘deadly pandemic’, or because of NG163 assisted dying (murder) protocol, or because they couldn’t be seen for serious conditions in hospitals which were packed to the gills with film crews and dancing nurses and doctors, or whatever. So up until now, the ONS just nixed the whole year when calculating average deaths, figuring that it would skew the ‘normal’ deaths. The cleverer approach, according to the ONS, is now just to take out the periods of exceptional mortality, leaving the rest of the year in the calculations. Really clever, Correct me if I’m wrong but in the months immediately following a very high mortality event, the number of registered deaths normally goes right down, simply because there are no longer enough people left expected to die ‘normally’. The ONS appears to be now including these artificially low mortality months, whilst excluding the very high mortality months. Which doesn’t seem very sensible to me I must admit.
The net result of this new improved method on estimates of excess deaths in previous years is a mixed bag. Some years, the new method estimates more excess deaths than the old, in other years, the new method estimates there to be very much fewer excess deaths than the old - notably 20,000 less excess deaths in 2023, which entirely coincidentally does tend to take the heat off the government right now.

This is the really interesting graph though:
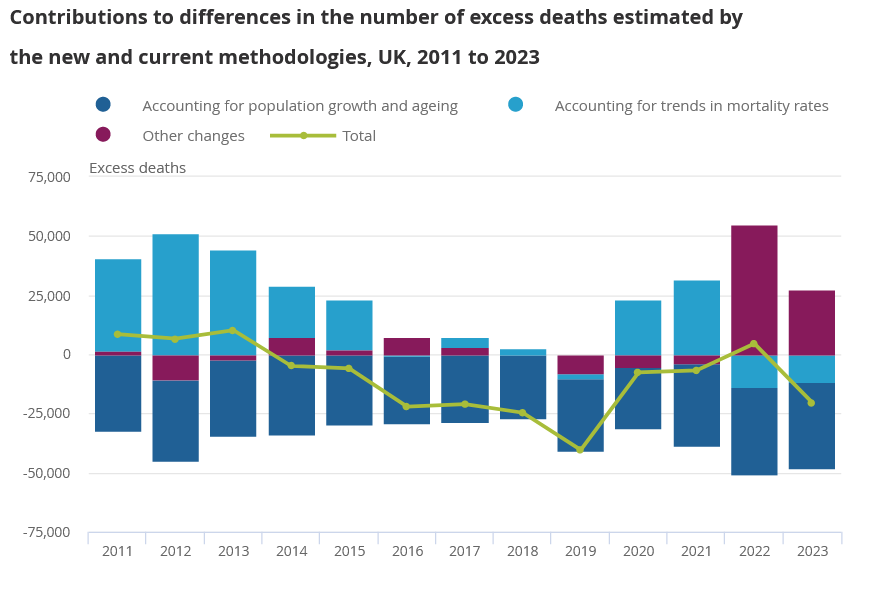
The green line is the difference in excess death estimates between the old and new methods. From 2013 to 2019, the new method estimated a steadily falling number of excess deaths compared to the old, which is accounted for by an increasing population and ageing population mainly, but with some contribution from a declining trend in mortality rates. Then after 2019, the new method suddenly provides increasingly higher estimates of excess mortality such that it is almost the same as the old method for 2020 and 2021. The reason for this is a sudden increasingly positive contribution from mortality rates. Then in 2022, that mortality rate contribution crashes from positive to negative and we see a huge increase in the positive contribution from ‘other changes’, which results in the new method estimating significantly more excess deaths in 2022 than the old. What ‘other changes’? Those ‘other changes’ become much smaller in 2023, whilst the negative contribution to excess death estimates from population growth, ageing and mortality trends remains large, thus resulting in the new method providing an estimate for excess deaths in 2023 which is 20k less than the previous ONS estimate.
The Fairy God Mother of statistics has waved her magic wand and got rid of 20,000 very troubling excess deaths in 2023. No doubt she will wave it again this year too.
2020 wasn’t a problem. Campaigner Rustler has statistics to show that (Scottish) hospital admissions and deaths in 2020 were the lowest on record, see https://x.com/TheRustler83/status/1759205326115545402?s=20.
Funeral director John O’Looney of Milton Keynes has given professional evidence that he noticed nothing abnormal about UK deaths throughout 2020, see from 3:20:30 in https://odysee.com/@GrandJury:f/Grand-Jury-Day-3-en-online:7.
Don’t forget that the average age of “Covid” victims in 2020 was 82, almost certainly the vast majority killed by callous iatrogenic maltreatment.
The new approach is better than the previous flat 5 year average. But I think it still has 2 fatal flaws:
1. It uses date of death registration, instead of date of death occurrence (this has caused some massive distortions since 2020).
2. It ignores "mortality displacement" (which is Jaime's point that high deaths in a given time period mean you should expect lower deaths in the following period, especially at older ages where most of the deaths occur).
The "Future developments" section acknowledges these points, but only in passing at the end of a long list of other points. https://www.ons.gov.uk/peoplepopulationandcommunity/healthandsocialcare/causesofdeath/articles/estimatingexcessdeathsintheukmethodologychanges/february2024
The other issue is that while most of the excess deaths in 2020 were at the older ages, we now have higher excess rates in the middle age bands - so we need to measure excess years of life lost, and how that has changed since 2020.