

NW Pacific Heatwave Attribution - Multiple Climate Model Failure
NW Pacific Heatwave Attribution - Multiple Climate Model Failure

The authors describe the models used thus:
Model simulations from the 6th Coupled Model Intercomparison Project (CMIP6; Eyring et al., 2016) are assessed. We combine the historical simulations (1850 to 2015) with the Shared Socioeconomic Pathway (SSP) projections (O’Neill et al., 2016) for the years 2016 to 2100. Here, we only use data from SSP5-8.5, although the pathways are very similar to each other over the period 2015–2021. Models are excluded if they do not provide the relevant variables, do not run from 1850 to 2100, or include duplicate time steps or missing time steps. All available ensemble members are used. A total of 18 models (88 ensemble members), which fulfill these criteria and passed the validation tests (Section 4), are used.
SSP5-8.5 means Shared Socioeconomic Pathway 5 combined with RCP8.5, leading to 8.5W/m2 GHG forcing at the earth's surface by 2100. It is a very extreme worst case emissions/atmospheric GHG concentration scenario, not at all realistic but, for the 5 years from 2016-2021, when it is used in the models, it doesn't make that much difference from other more realistic scenarios. Where it does make a great deal of difference is in the assessment of how much more frequent such extreme heatwaves will be over the coming century, which the authors rely on to make the alarming claim that such events will happen every 5-10 years by 2100.
The authors used other models as well for simulating the historical period:
In addition to the CMIP6 simulations, the ensemble of extended historical simulations from the IPSL-CM6A-LR model is used (see Boucher et al., 2020 for a description of the model). It is composed of 32 members, following the CMIP6 protocol (Eyring et al., 2016) over the historical period (1850-2014) and extended until 2029 using all forcings from the SSP2-4.5 scenario, except for the ozone concentration which has been kept constant at its 2014 climatology (as it was not available at the time of performing the extensions). This ensemble is used to explore the influence of internal variability.
We also examine five ensemble members of the AMIP experiment (1871-2019) from the GFDL-AM2.5C360 (Yang et al. 2021, Chan et al. 2021), which consists of the atmosphere and land components of the FLOR model but with horizontal resolution doubled to 25 km for a potentially better representation of extreme events.
They describe the basic attribution procedure as follows:
As discussed in section 1.2, we analyse the annual maximum of daily maximum temperatures (TXx) averaged over 45°N-52°N, 119°W-123°W. Initially, we analyse reanalysis data and station data from sites with long records. Next, we analyse climate model output for the same metric. We follow the steps outlined in the WWA protocol for event attribution. The analysis steps include: (i) trend calculation from observations; (ii) model validation; (iii) multi-method multi-model attribution and (iv) synthesis of the attribution statement.
The first stage of the process above is known as 'detection', i.e. the detection of the event from observations. Observations are then compared to models to arrive at an attribution. Here is what the authors say about the detection:
The detection results, i.e., the comparison of the fit for 2021 and for a pre-industrial climate, show an increase in intensity of TXx of ΔT = 3.1 ºC (95% CI: 1.1 to 4.7 ºC) and a probability ratio PR of 350 (3.2 to ∞).
They then introduce the section on the multi-model attribution:
5 Multi-method multi-model attribution
This section shows probability ratios and change in intensity ΔT for models that pass the validation tests and also includes the values calculated from the fits to observations (Table 2). Results are given both for changes in current climate (1.2°C) compared to the past (pre-industrial conditions) and, when available, for a climate at +2˚C of global warming above pre-industrial climate compared with current climate. The results are visualized in Section 6.
Here are the results:
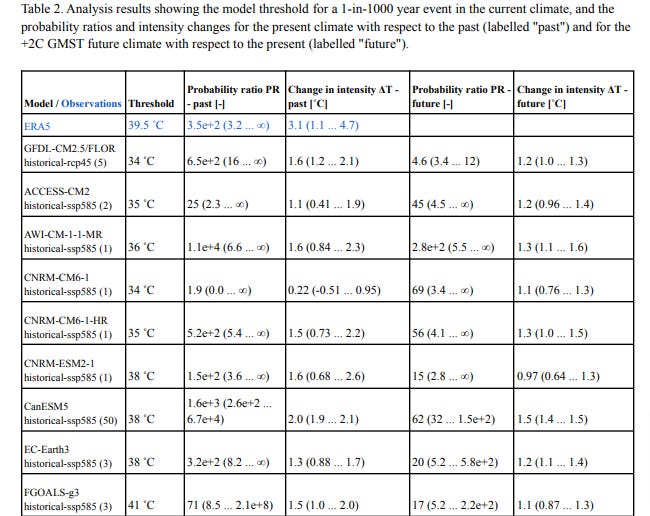

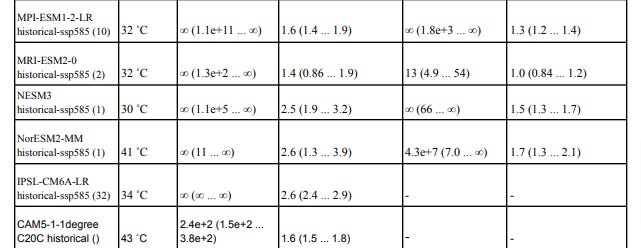
Note that the observed change intensity of the heatwave in the study area is 3.1C, according to observations (ERA5). The best estimate modelled change in intensity is anywhere between 0.22C and 2.6C, i.e. none of the models actually capture the observed change in intensity. The mean best estimate change in intensity of all the models is 1.77C, which is just 57% of the actual observed change. Thus, the models don't come close to simulating actual reality. But again, this does not deter the authors from going ahead with an attribution anyway. They call it a hazard synthesis. I call it a hazardous synthesis!
6 Hazard synthesis
We calculate the probability ratio as well as the change in magnitude of the event in the observations and the models. We synthesise the models with the observations to give an overarching attribution statement (please see e.g. Kew et al. (2021) for details on the synthesis technique including how weighting is calculated for observations and for models).
Results for current vs past climate, i.e. for 1.2°C of global warming vs pre-industrial conditions (1850-1900), indicate an increase in intensity of about 2.0 ˚C (1.2 ˚C to 2.8 ˚C) and a PR of at least 150. Model results for additional future changes if global warming reaches 2°C indicate another increase in intensity of about 1.3 ˚C (0.8 ˚C to 1.7 ˚C) and a PR of at least 3, with a best estimate of 175. This means that an event like the current one, that is currently estimated to occur only once every 1000 years, would occur roughly every 5 to 10 years in that future world with 2°C of global warming.
So there you are. A highly dubious statistical analysis combined with an observation/model synthesis using models which all fail to capture the observed intensity of the actual event, which mysteriously translates into the statement that the NW Pacific heatwave would be 'virtually impossible without climate change' and furthermore that we can expect such intense heatwaves every 5 to 10 years by the end of the century if we don't urgently reduce emissions. What a farce and an insult to proper science, but it did its job, i.e. generated alarming, but highly misleading headlines around the world re. the supposed irrefutable connection with this extreme weather event and man-made climate change.
Update: 16th January 2023
Actually, the prediction that this extreme event would happen every 5-10 years was based on global warming of 2C. Otto was arguing that we could reach 2C global warming in just 20 years from now, not in 2100. That would require a very sudden and massive acceleration in the observed long term rate of global warming:
Co-author Dr Friederike Otto, from the University of Oxford, explained what the researchers meant when they said the extreme heat was "virtually impossible" without climate change.
"Without the additional greenhouse gases in the atmosphere, in the statistics that we have available with our models, and also the statistical models based on observations, such an event just does not occur," she explained.
"Or if an event like this occurs, it occurs once in a million times, which is the statistical equivalent of never," she told a news briefing.
This type of research, which seeks to determine the contribution of human-induced climate change to extreme weather events, is known as an attribution study.
According to the analysis, if the world warms by 2C, which could happen in about 20 years' time, then the chances of having a heatwave similar to last week's drop from around once every 1,000 years to roughly once every 5-10 years.
https://www.bbc.com/news/science-environment-57751918