


Debunking The Met Office's Ridiculous 'Unprecedented' NAO Scare Story

Another day, another absurd climate alarmist scare story, this time coming from the Met Office, who are no longer a serious scientific institution devoted to researching and predicting our weather, but merely a climate change propaganda outfit pushing the Net Zero Marxist/globalist agenda. Their latest nonsense illustrates this perfectly.

As always with these scare stories, the truth is rather more mundane and you have to actually read the source study used to generate the media propaganda in order to see why the alarmist claptrap doesn’t stack up. Because the source study in this case is junk science, not supported by real world data and actual science and evidence. It’s just pie in the sky unrealistic climate modelling. What else can you expect from our corrupt, politically captured Met Office, the UK’s exclusive Communist weather service?
But before doing so, let’s just examine what the media are saying. First, Phys.org:
A new study reveals that the North Atlantic Oscillation (NAO) could reach unprecedented magnitudes by the end of the century, leading to severe impacts such as increased flooding and storm damage in northern Europe.
The NAO is a large-scale atmospheric pressure see-saw in the North Atlantic and is a key driver of winter weather patterns in the U.K., western Europe and eastern U.S.
It is measured by the gradient between high pressure over the Azores and low pressure over Iceland and controls the strength of the prevailing winds.
The findings indicate that under a scenario with very high concentrations of greenhouse gases by the end of the century, the NAO will increase to levels never before seen, posing severe risks of impacts from extreme weather such as flooding and storm damage.
"However, these impacts could be mitigated through efforts to reduce greenhouse gas emissions."
Professor Adam Scaife, who co-authored the study, said, "This study shows that better understanding the response of atmospheric circulation to greenhouse gases is crucial for anticipating what climate change has in store for the U.K."
The Daily Fail is even worse; they falsely conflate the changes in NAO, which is a predominantly atmospheric phenomenon, with changes in AMOC, which is oceanic, and falsely claim that we’re going to get more extreme cold weather as NAO goes extreme negative, as well storms and floods, as it goes extreme positive, by the end of this century.

Always the same message though: ‘OMG, we’re all going to DIE - unless we reduce GHG emissions!’ But it’s total bullshit. Because the model projections of catastrophe are all based on “extremely unlikely” projections of future industrial/transport greenhouse gas emissions, and even then, the range of uncertainty in the model projections is huge, because the models themselves are very imperfect and they run way too hot. But hey, don’t let inconvenient facts get in the way of a good scare-story-come-communist-behavioural-nudge designed to encourage us to give up our gas boilers and petrol and diesel cars and eat insects instead of real meat, as well as accepting the proliferation of totally useless solar panels on thousands of acres of valuable farmland - including farmland in Scotland, not known for its unbroken Mediterranean type sunshine. Incidentally, when I ran the ‘planet saving insect diet’ by dear Alfa a few years ago, this was her response:

I’ve been vegetarian for years, but even I’m not eating insects to stop bad weather and I’m certainly not going to give up my gas boiler and diesel car and van either on the basis of ludicrous scaremingering (not a typo) like that above from the Met Office.
Here’s why. The study is junk, skip-ready ‘science’. Its title gives the game away. It is not scientific research, it is policy advocation (evidence-free policy advocation):

The study sets out the following challenges to modelling NAO:
Understanding how the NAO will change in future decades is key for developing effective adaptation measures. However, there are three major challenges to overcome.
First, model simulations of the NAO are highly chaotic, such that tiny changes that would be impossible to measure can lead to opposite trends.
Second, simulations of atmospheric circulation depend on the model used, leading to large uncertainties.
Third, observed changes are at the limit or even beyond those simulated by climate models and the drivers of past multi-decadal changes in North Atlantic climate are very poorly understood. Of over 300 simulations from the latest Coupled Model Intercomparison Project (CMIP6), none captured the observed strengthening of the North Atlantic jet over the 70-year period 1951–2020, and only two simulated an NAO increase as large as that observed.
But undaunted, our intrepid team of scientists (Adam Scaife et al) at the UK Met Office think they can rise to these considerable challenges and offer future projections of what our weather will be like in 75 years time which are accurate enough to require a radical policy response which will immiserate and impoverish normal British people right now, deindustrialise our economy, wreck our countryside, decimate traditional farming and drastically reduce our quality of life and personal wealth. If you believe that, I’ve got a burning bridge to sell you. They explain NAO variability in terms of a simplistic relative warming (or cooling) of the stratosphere and troposphere and how that affects the northern hemisphere jet streams, with major volcanic eruptions cooling the upper troposphere vs. GHGs warming the upper troposphere and cooling the stratosphere. An unspecified role is reserved for natural solar variability and ‘other drivers’ because basically they don’t have a clue how these might affect NAO and can’t really be bothered to find out anyway, because that might mess up their nice neat scare story.
Our results suggest that multi-decadal variations in the NAO are largely driven by trends in the upper troposphere meridional temperature gradient ∂T¯∂ϕ, similar to the effect on upper-level winds found in earlier studies73. Major volcanic eruptions cool the tropical upper troposphere, weakening ∂T¯∂ϕ and resulting in a tendency towards negative NAO, whereas GHGs warm the tropical upper troposphere and cool the stratosphere, strengthening ∂T¯∂ϕ and resulting in a tendency towards positive NAO. Although volcanoes and GHGs dominated the period since 1850, solar variations can also affect ∂T¯∂ϕ47,48 and could be important in other periods74. We stress that our emergent constraint only explains some of the model differences and that other drivers could also be important63,64,65,66,67 and should be investigated in the future.
The headline ‘unprecedented increases in NAO’ resulting in storms and flooding - plus policy prescription - comes entirely from this Met Office team using the extreme high end SSP5-8.5 emissions scenario in their overheated models:
Despite uncertainties in the RPS (Methods), our calibrated projections suggest that, under the high-emissions scenario (SSP5-8.5) and in the absence of major volcanic eruptions, the multi-decadal NAO will increase to unprecedented levels by 2100, 1.4 to 3.7 times greater than any in the historical period. This will probably cause severe impacts on society, especially increased flooding and storm damage in Northern Europe. However, we found a clear capability for mitigation to avoid such impacts.
But, there is no justification for using this scenario. It is totally unrealistic. Here for instance:
Recent studies, however, showed that a substantial number of CMIP6 GCMs run “too hot” because they appear to be too sensitive to radiative forcing, and that the high/extreme emission scenarios SSP3-7.0 and SSP5-8.5 are to be rejected because judged to be unlikely and highly unlikely, respectively. Yet, the IPCC AR6 mostly focused on such alarmistic scenarios for risk assessments.
In fact, Ritchie and Dowlatabadi (2017) affirmed that the “SSP5-RCP8.5 should not be a priority for future scientific research or a benchmark for policy studies”; it is very unlikely because such scenario is based on the implausible assumption of a massive increase of the use of coal that is supposed to substitute all the other forms of energy production. Hausfather and Peters (2020) stated that the “the ‘business as usual’ story is misleading” and invited researchers “to stop using the worst-case scenario for climate warming as the most likely outcome” because only “more-realistic baselines make for better policy”. Hausfather and Peters (2020) described SSP5-8.5 as “highly unlikely”, SSP3-7.0 as “unlikely” (as it requires the reversal of some current policies) and SSP2-4.5 as “likely” (because it is the most consistent with current policies).
The SSP5-8.5 and SSP3-7.0 scenarios were also recognized as unrealistic by Burgess et al. (2020) and Pielke and Ritchie, 2021a, Pielke and Ritchie, 2021b, who argued that the IPCC might have misused these scenarios for more than a decade. Pielke et al. (2022) and Burgess et al. (2023) also found that another and even more moderate SSP scenario — the SSP2-3.4, which was ignored by the IPCC AR6 — optimally agrees with the reported emissions from 2005 to 2020 and with the most recent projections of the IEA, 2020: World Energy Outlook, 2020, IEA, 2021: World Energy Outlook, 2021 up to 2050. This would imply that the world could be on pace for even more moderate global warming by 2100 than what SSP2-4.5 implies.
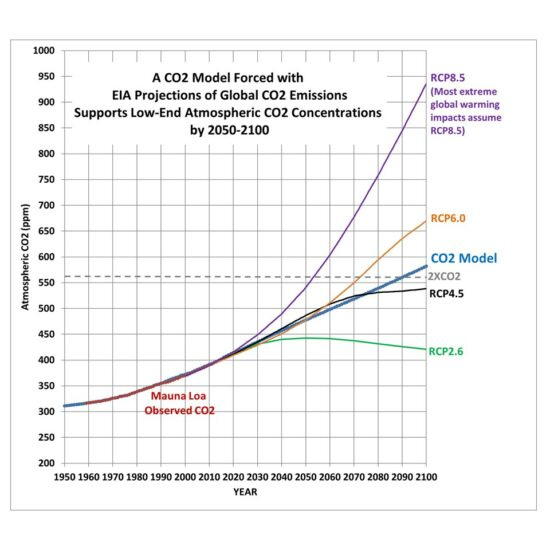
For example, SSP3-7.0 and SSP5-8.5 demand that CO2 atmospheric concentrations climb from around 420 ppm to almost 867 ppm and 1135 ppm, respectively, from 2020 to 2100, which looks to be excessively high; yet, SSP2-4.5 requires a more plausible 602 ppm level by 2100 (Meinshausen et al., 2020). See also Meinshausen et al. (2023) who reviewed the next generation of Earth system model likely scenarios.
Is a CO2 concentration of over 1000ppm under SSP5-8.5 at all realistic? Not according to this analysis from Dr Roy Spencer:
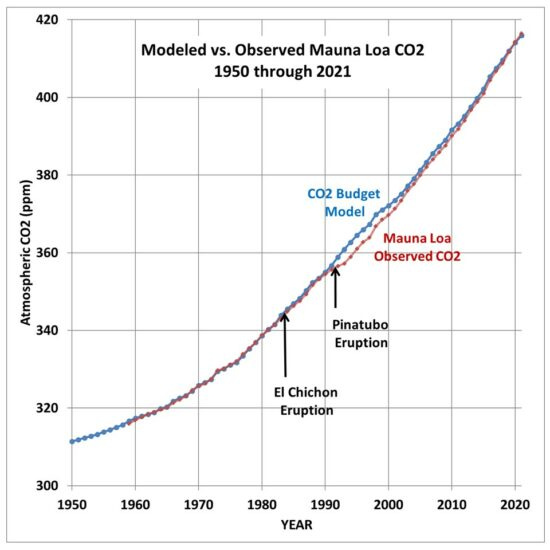
The simple CO2 budget model I introduced in 2019 is updated with the latest Mauna Loa measurements of atmospheric CO2 and with new Energy Information Administration estimates of global CO2 emissions through 2050. The model suggests that atmospheric CO2 will barely double pre-industrial levels by 2100, with a total radiative forcing of the climate system well below the most extreme scenario (RCP8.5) used in alarmist literature.
A simple budget model of the atmospheric CO2 concentration very accurately matches the Mauna Loa CO2 data during 1959-2021 using yearly estimates of global anthropogenic CO2 emissions as a CO2 source, and the observed average rate of removal of CO2 by biological and physical processes, which is proportional to the “excess” of atmospheric CO2 over a baseline of 295 ppm as a sink. An empirical factor to account for El Nino and La Nina activity is also included, which mostly affects year-to-year fluctuations in CO2.
The resulting model projection produces atmospheric CO2 concentrations late this century well below the IPCC RCP8.5 scenario, and even below the RCP6.0 scenario. This suggests that the most dire climate change impacts the public hears about will not happen.
So the Met Office’s scaremingering projections of “unprecedented” increases in NAO by 2100 look to be extremely dubious to say the least; fraudulent might be a more appropriate term.
The fact that they never mention the Atlantic Multidecadal Oscillation (60 to 70-year periodicity, 1970s-like cold phase imminent) or the Grand Solar Minimum (400-year periodicity, Maunder Minimum-like cold phase imminent) is all the proof you need that they are lying (by omission).
You have to remember that with Computer Simulations, if you feed garbage in you get bull-shit out. (I think that's the technical term.)