


BBC: 'Climate Change Made Muh Easter Egg More Expensive!'

Says Justin Rowlatt at the BBC:
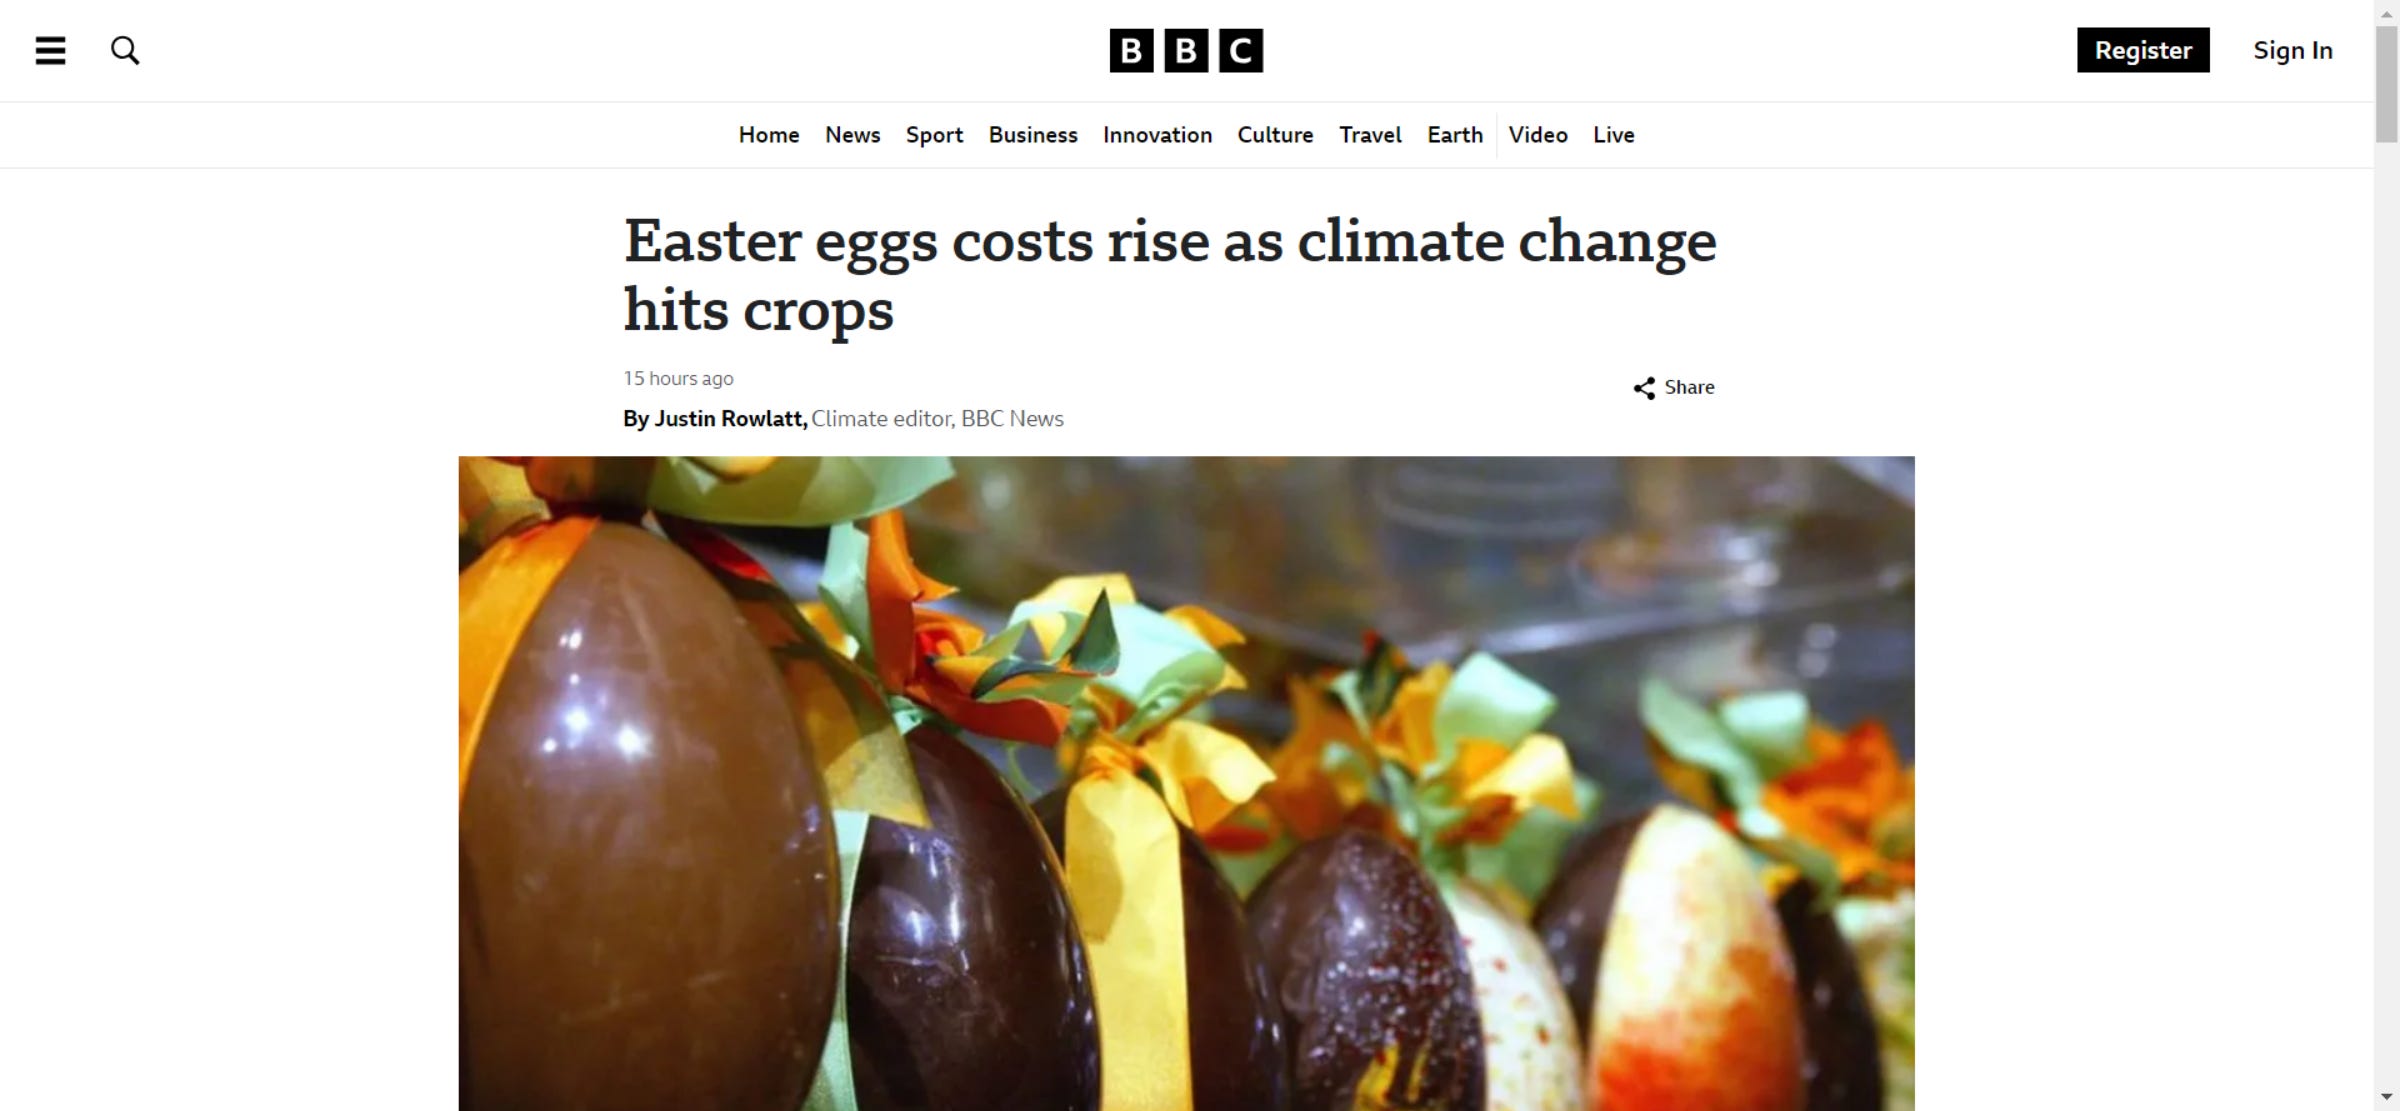
You may have noticed that Easter eggs are more expensive this year.
But did you know that climate change is one of the reasons?
Most chocolate is made from cocoa grown in West Africa, but a humid heatwave has blasted the crops and massively cut yields.
Experts say that human-induced climate change has made the extreme heat 10 times more likely.
Which? found some popular eggs have risen in price by 50% or more.
This is a bit strange because the price of my chocolate bar has not increased at all and similarly, I haven’t noticed an increase in the price of a tin of cocoa powder at the supermarket. It couldn’t actually be that Easter Egg manufacturers and shops are dishonestly cashing in this year by unjustifiably hiking the price of chocolate eggs could it?
Rowlatt continues:
Most global production is concentrated in West Africa. In 2023, 58m kilogrammes of cocoa beans worth £127m were imported to the UK from Ivory Coast and Ghana with 85% of the UK's cocoa beans sourced from Ivory Coast.
However, severe drought conditions have hit the West Africa region since February this year.
This has been caused by temperatures that soared above 40C, breaking records in countries including the Ivory Coast and Ghana.
It was these exceptionally high temperatures that the World Weather Attribution group, based at Imperial College London, found were made 10 times more likely by human-caused greenhouse gas emissions.
Their study found that unless the world quickly reduces fossil fuel use, West Africa will experience similar heatwaves about every two years.
"There were reports from farmers in Ivory Coast that the heat weakened the cocoa crop," according to one of the authors of the study, Izadine Pinto, from the University of Cape Town.
He said the high temperatures increased the rate of evaporation, leaving the crops without sufficient moisture.
Another factor impacting the crops was El Niño.
This is a recurring, natural fluctuation in weather patterns in the tropical Pacific that drives up global temperatures and can lead to extreme weather in some places. A strong El Niño has been active since last June.
El Niño years often present challenges for farmers, but global warming is exacerbating those changes, says Ben Clarke, an expert on extreme weather at the Grantham Institute at Imperial College.
"Increasingly, climate change driven by fossil fuel use is multiplying this natural challenge in many regions. It fuels more extreme conditions, devastates harvests, and makes food costs higher for all," Mr Clarke said.
Drought is not the only factor affecting cocoa growers. Both Ivory Coast and Ghana have been hit with an extreme weather double whammy.
In December last year, both countries experienced intense rains. Total precipitation in West Africa was more than double the 30-year average for the time of year.
The wet and humid conditions allowed a fungal infection called black pod disease to flourish, rotting cocoa beans on the trees.
The result of these different extreme events has been the same - the price of cocoa has more than trebled since this time last year and doubled in just the last three months.
So, according to Rowlatt, drought, high temperatures, humidity, high rainfall and El Nino have all driven up the price of cocoa, but climate change is to blame because of an attribution study by ‘experts’ at Imperial College London.
The actual study doesn’t look specifically at temperature, nor rainfall, nor humidity, it examines an increase in what is known as the heat index, which is a ‘feels like’ weather variable combining relative humidity and absolute temperature. Thus, when it’s both hot and humid, and the heat index is high, the heat which we humans actually perceive is far more oppressive and uncomfortable than if it was just very hot but very dry also (as in the desert). The attribution study only looked at a five day window of exceptional temperature and humidity from February 15-19, 2024, stretching along the coastal region of southern west Africa. Thus, it is only those 5 days and just the heat index itself throughout those 5 days which supposedly can be attributed to climate change. That is the extreme weather event which is the focus of the study. The BBC is asking us to believe therefore that the increase in the price of cocoa and thus presumably the price of our Easter eggs has been significantly affected by climate change impacting the weather (and therefore the cocoa crop) in Africa for just 5 days! I find that a little hard to swallow.
But even if you accept the argument that a 5 day window of extreme weather caused by climate change is responsible for expensive Easter eggs, when you examine the actual study itself in detail, this claim looks far from convincing.
The ‘experts’ used a combination of weather ‘observations’ (more on that in a moment), climate models and statistical ‘generalised extreme value’ (GEV) analysis - based on the assumption that extremes are solely the result of a shift in global mean surface temperature of 1.2C since 1850, all of which is assumed to be caused by man-made greenhouse gas emissions. No credit whatsoever is given to natural climate change, land use change or indeed natural weather for the resulting extremes. That’s pseudoscience; it’s not science.
The dodgy statistical analysis is bad enough, but the models are actually worse and the ‘observations’ are mostly models too! There aren’t many weather stations in west Africa, certainly not WMO class 1 rated stations and not even class 5 rated, so beloved of our own British Met Office when it comes to finding maximum temperature records hidden down the back of the sofa. So the authors of this study had to use reanalysis datasets (meteorological models) for estimates of relative humidity and temperature:
We use two gridded datasets to fit probability distributions to variables of interest within the study regions and to analyze heat wave events within the broader context of climate change. The first dataset is the European Centre for Medium-Range Weather Forecasts (ECMWF) ERA5 reanalysis product (Hersbach et al., 2020). The reanalysis begins in 1950, with data available until the end of February 2024. We use daily maximum temperature, 2-meter air temperature, and dew point temperature for the calculation of relative humidity and heat index (see section 2.3). This dataset is available at 0.5° resolution from ECMWF. It should be noted that the variables from ERA5 are not directly assimilated, but these are generated by atmospheric components of the Integrated Forecast System (IFS) modelling system.
As a second dataset, we use the Multi-Source Weather (MSWX) v2.8 dataset (updated from Beck et al., 2019), a fully global product, available at 3-hourly intervals and at 0.1° spatial resolution, available from 1979 to present. This product combines gauge-, satellite-, and reanalysis-based data.
We use daily maximum temperatures and relative humidity from this product.
So, the ‘attribution study’ in question basically consists of comparing largely meteorological model output to heavily biased generalised extreme value statistical analysis plus the output from equally biased climate models. Farcical.
Also, even earlier in the month, during February 1998, daily heat index values exceeded those recorded in February 2024.
The surface air temperature worldwide in February 2024, based on ERA5 data, reached a record high, exceeding the February average for 1991-2020 (C3S,2024) by 0.81°C. The Guinea zone in West Africa (Figure 2, blue box; hereafter study area) witnessed exceptionally hot temperatures for several days. The average temperature over the Guinea zone reached a record high, exceeding the February average for 1991-2020 by 1.40 °C (Figure A1). The Heat Index (HI), which quantifies the perceived temperature, taking into account both the actual air temperature and relative humidity, over the study area for February 2024 reached the highest value since February 1998 (Figure 3c, ERA5).
1998 was an El Nino year, as is 2024, though not as strong as the El Nino of 1998. This suggests that El Nino plays a role in the occurrence of extreme February heat and humidity in west Africa, but the authors ignore any influence El Nino might have had (needless to say, they also ignore any influence which certain volcanoes which shall not be named also might have had):

The El Niño Southern Oscillation (ENSO) phenomenon impacts the global atmospheric circulation, causing shifts in weather patterns worldwide and temporarily raising global temperatures. Oueslati et al. (2017) showed that El Niño plays an important role in heatwaves in the Sahel region in the phase where El Niño is declining. They showed that for April-June, heat waves over the Sahelian region are warmer following warmer ENSO events, which results from amplified water vapour feedback. In the current study, we did not find a strong contribution from the July-June mean or the December-February mean of the El Niño phase to the annual maximum HI over the region we studied.
The addition of a Nino3.4 index to the statistical model alongside the GMST did not affect the estimated strength of the trend depending on GMST, although it did influence the expected intensity of individual heat waves. Therefore, in this analysis, we continue with GMST as the only covariate.

The MSWX dataset (blue), unlike the ERA5 product (red), did not show the 5 day heat index in February 1998 exceeding 2024, so there is some inconsistency even in the ‘observations’ between the two datasets.
The farce is strong in this attribution study, especially when it comes to examining the climate models, because they’re all supercharged with the highly unrealistic high end RCP8.5 and SSP5-8.5 emissions scenarios. Roger Pielke Jr. has pointed out again and again how climate scientists continue to prefer these totally unjustifiable scenarios because they generate scarier outcomes and thus scarier headlines in the media when studies are reported on.
We use two multi-model ensembles from climate modelling experiments using different framings (Philip et al., 2020): Regional climate models and coupled global circulation models.
1. Coordinated Regional Climate Downscaling Experiment (CORDEX)-Africa Domain (AFR-CORDEX) with 0.44° resolution (Giorgi et al. 2009) comprising 10 simulations resulting from pairings of Global Climate Models (GCMs) and Regional Climate Models (RCMs). These simulations are composed of historical simulations from 1950 up to 2005, and extended to the year 2100 using the RCP8.5 scenario.
2. Coupled Model Intercomparison Project Phase 6 (CMIP6), which consists of simulations from 20 participating models with varying resolutions. For more details on CMIP6, please see Eyring et al., (2016). For all simulations, the period 1850 to 2015 is based on historical simulations, while the SSP5-8.5 scenario is used for the remainder of the 21st century.
So the regional and global climate models are both simulating climate in 2024 using these very high end emissions inputs and thus they can be expected to generate the maximum possible temperatures. But even so, all of the models fall far short of the actual observations:

The horizontal scale is the change in intensity of the 5 day heat index (in degrees Celsius) expected under a climate warming of 1.2C since 1850, using the models. You can see that very few come even close to the average of the observations (dark blue bar). The average of the models (dark red) looks to be about 3.2C. The average of the observations is about 4.4C. Thus the climate models comprehensively fail to simulate ‘reality’ - where reality itself consists mainly of reanalysis output from meteorological models!
In summary, this ‘attribution’ analysis of a 5 day spell of hot humid weather in west Africa, linking said weather event to climate change, is a pseudoscientific farce. The BBC files farce upon farce by claiming further that our Easter eggs have gone up in price partly as a result of these 5 days and thus catch-all climate change is, by logical deduction, the main culprit responsible for the increase in the price of Easter eggs.
But it actually gets even more farcical because the study in question admits that there has been rapid, uncontrolled urbanisation in the very region where the alleged ‘climate changed’ event took place:
Since the 1980s, West Africa is undergoing rapid urbanization (López-Calix et al., 2018). West Africa has some of the most populous cities in Africa (Rohat et al., 2019). Urbanizing the fastest, Sub-Saharan Africa is expected to double its urban population by 2050 (OECD, n.d.). Beyond the increasing urban population, the simultaneous trends of population growth and a heating planet result in more people exposed to extreme heat (Fotso-Nguemo et al., 2022). While studies on urban heat island (UHI) effects in African cities remain limited (Simwanda et al., 2019), significantly increased land surface temperatures in densely populated and built up spaces have been identified in cities including Cotonou, Benin (Teka et al., 2017), Lomé, Togo (Polorigni et al., 2018), Accra and Kumasi, Ghana (Buo et al., 2020; Athukorala & Murayama, 2020), Abidjan, Cote d’ivoire (Dongo et al., 2018), Freetown, Sierra Leone (Tarawally et al., 2018; Freetown City Council, 2022), and Abuja, Ilorin, and Lagos, Nigeria (Adeyeri et al., 2017; Basset et al., 2020; Amusa et al., 2022). Understanding, and addressing, the drivers of urban heat risk is especially urgent given the region’s largely unplanned urbanization, having contributed to a situation in which over half of its urban population resides in informal settlements (World Bank, 2020).
After admitting that the urban heat island (UHI) effect has been identified as playing a significant role in increased land surface temperatures in the region, the study authors then completely ignore it to focus instead upon the effects of climate change! Justin Rowlatt at the BBC ignored it too. It’s highly unlikely that he even bothered to read the study before he decided to enlighten us with his alternative ‘facts’. Extreme weather attribution and its reporting in the MSM is a circus of clowns.
With the help of RCP 8.5 there is no weather that the World Weather Attribution group cannot attribute to Climate Change™️. I get the feeling that their models are tuned rather like Mann's Hockey Schtick which turns random noise into a blade.
Climate change still hasn't got around to pushing up the price of my regular chocolate bars. I suspect climate change might be biased against the celebration of major Christian festivals.
https://thewalrus.ca/christmas-tree-shortage/